Performance feedback and support crucial for retaining Black employees

13 min read
| Published on
Black employees face career opportunity gaps
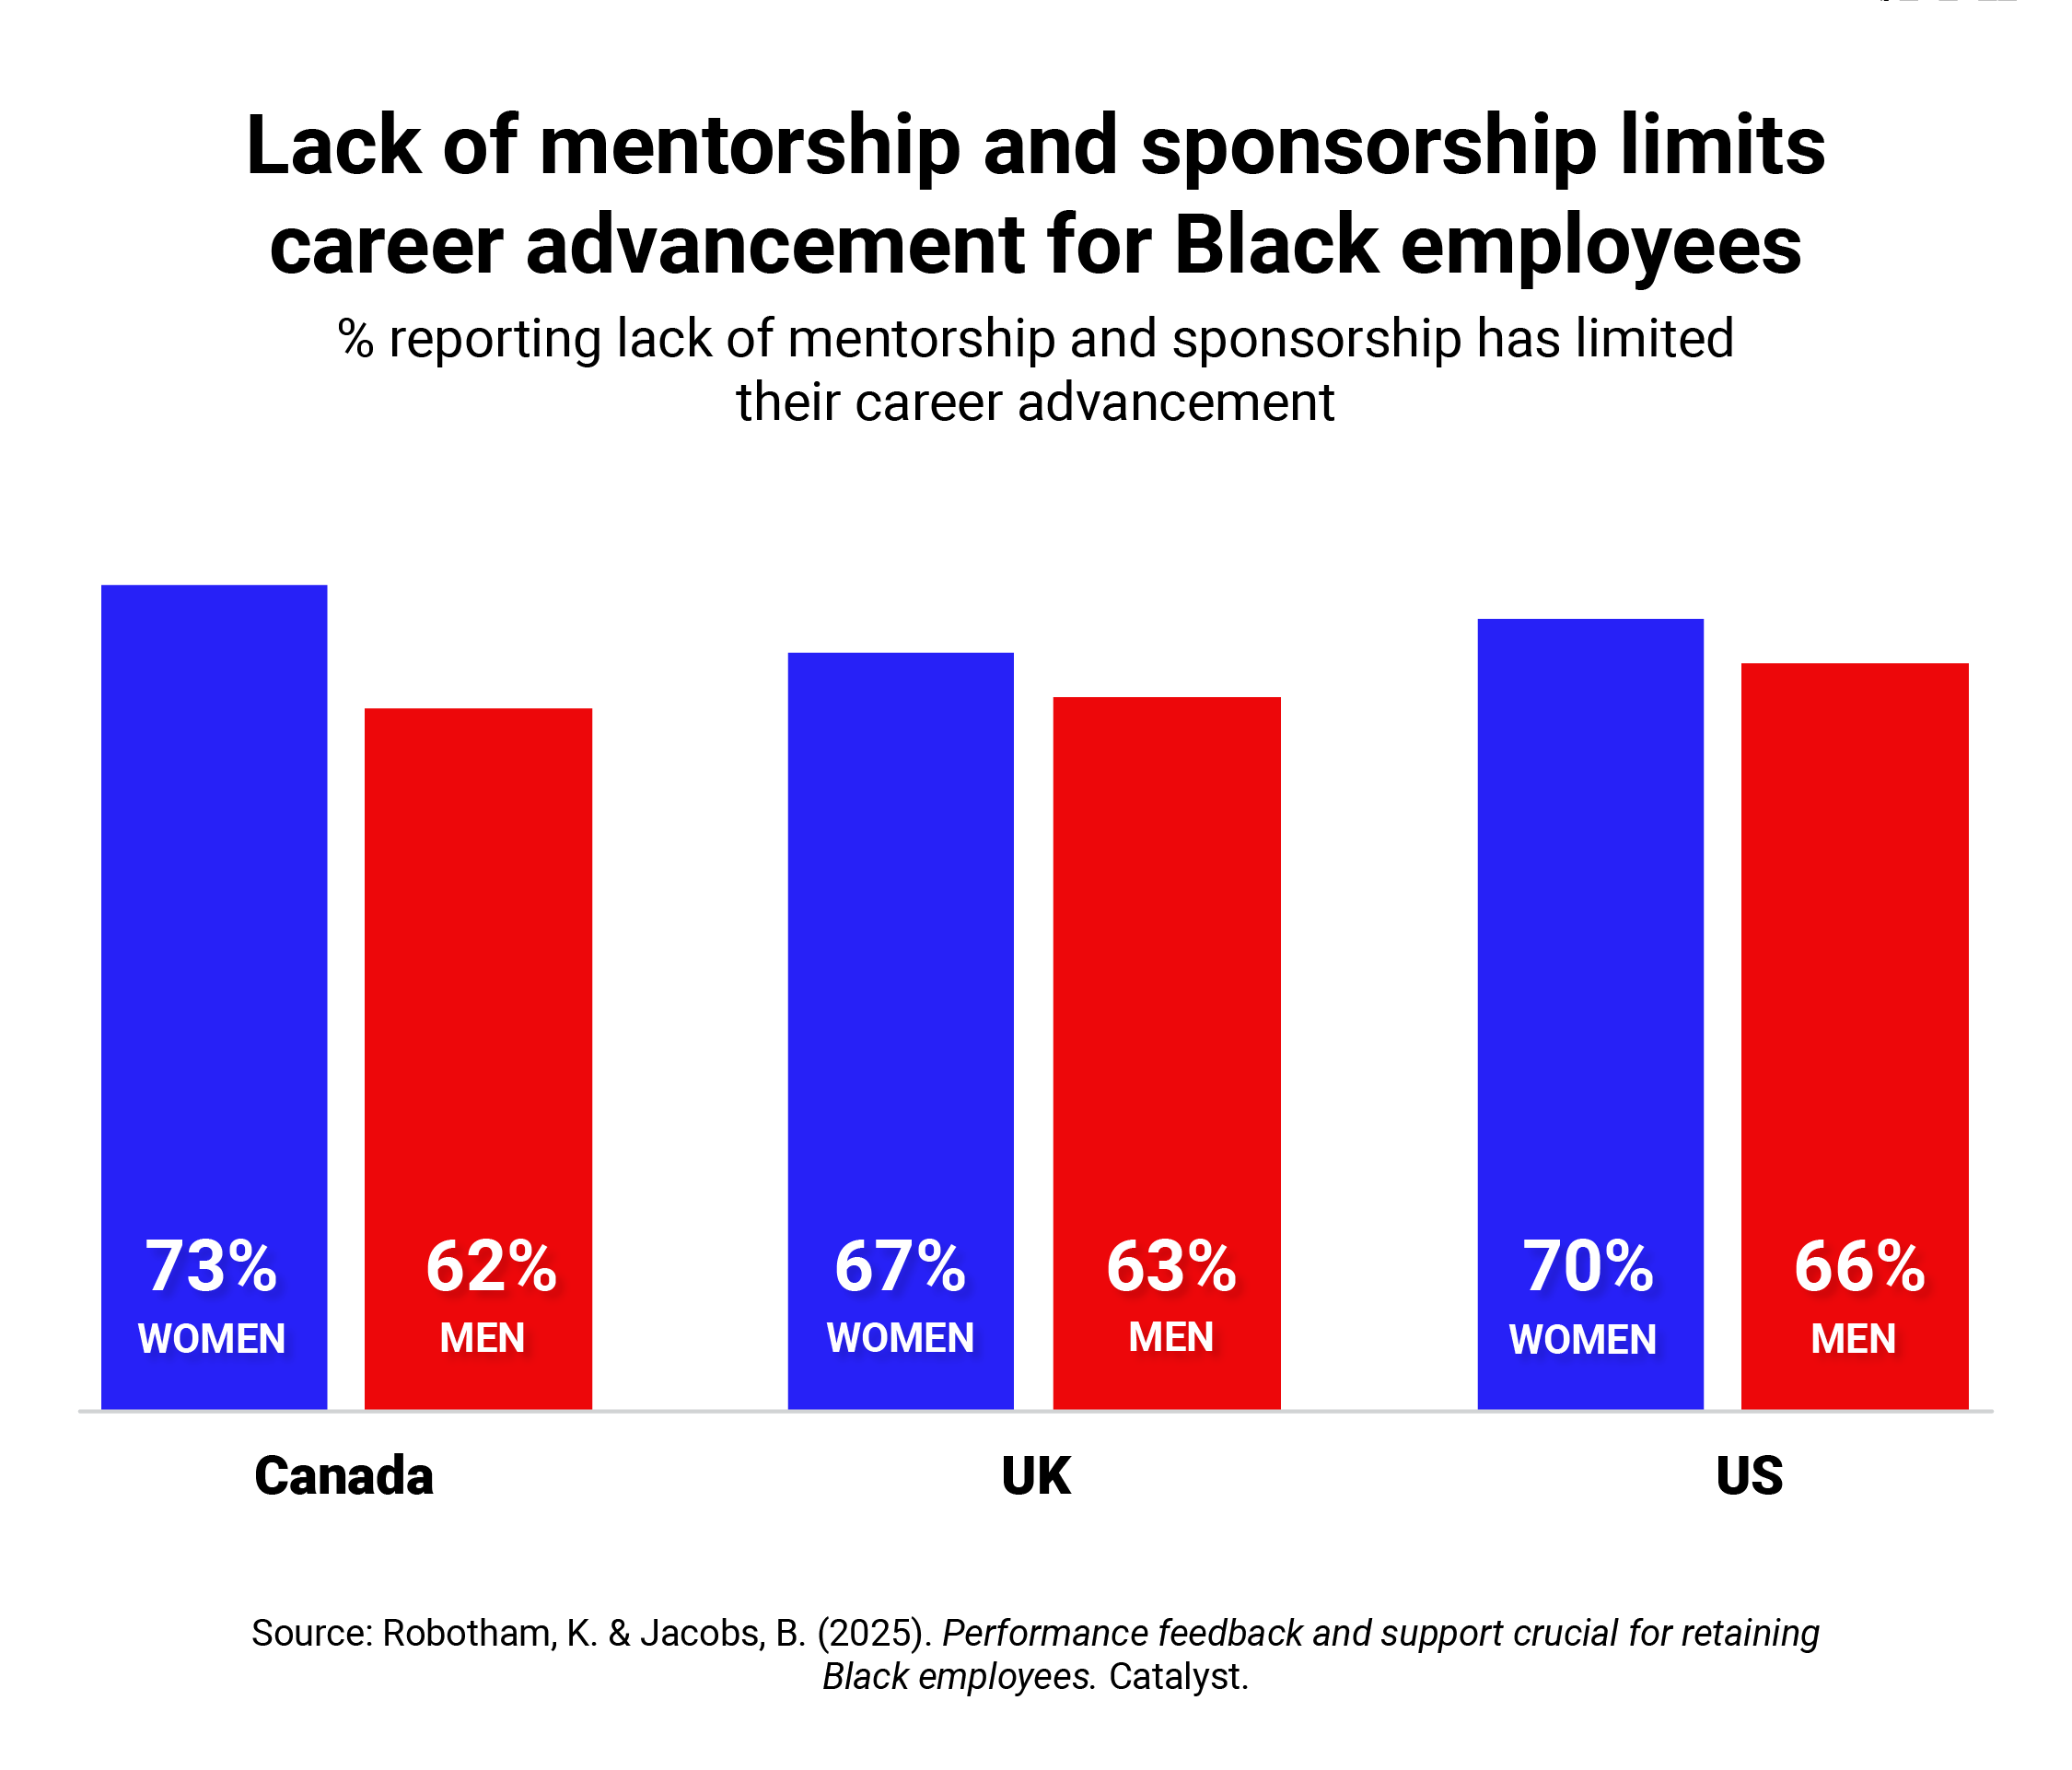
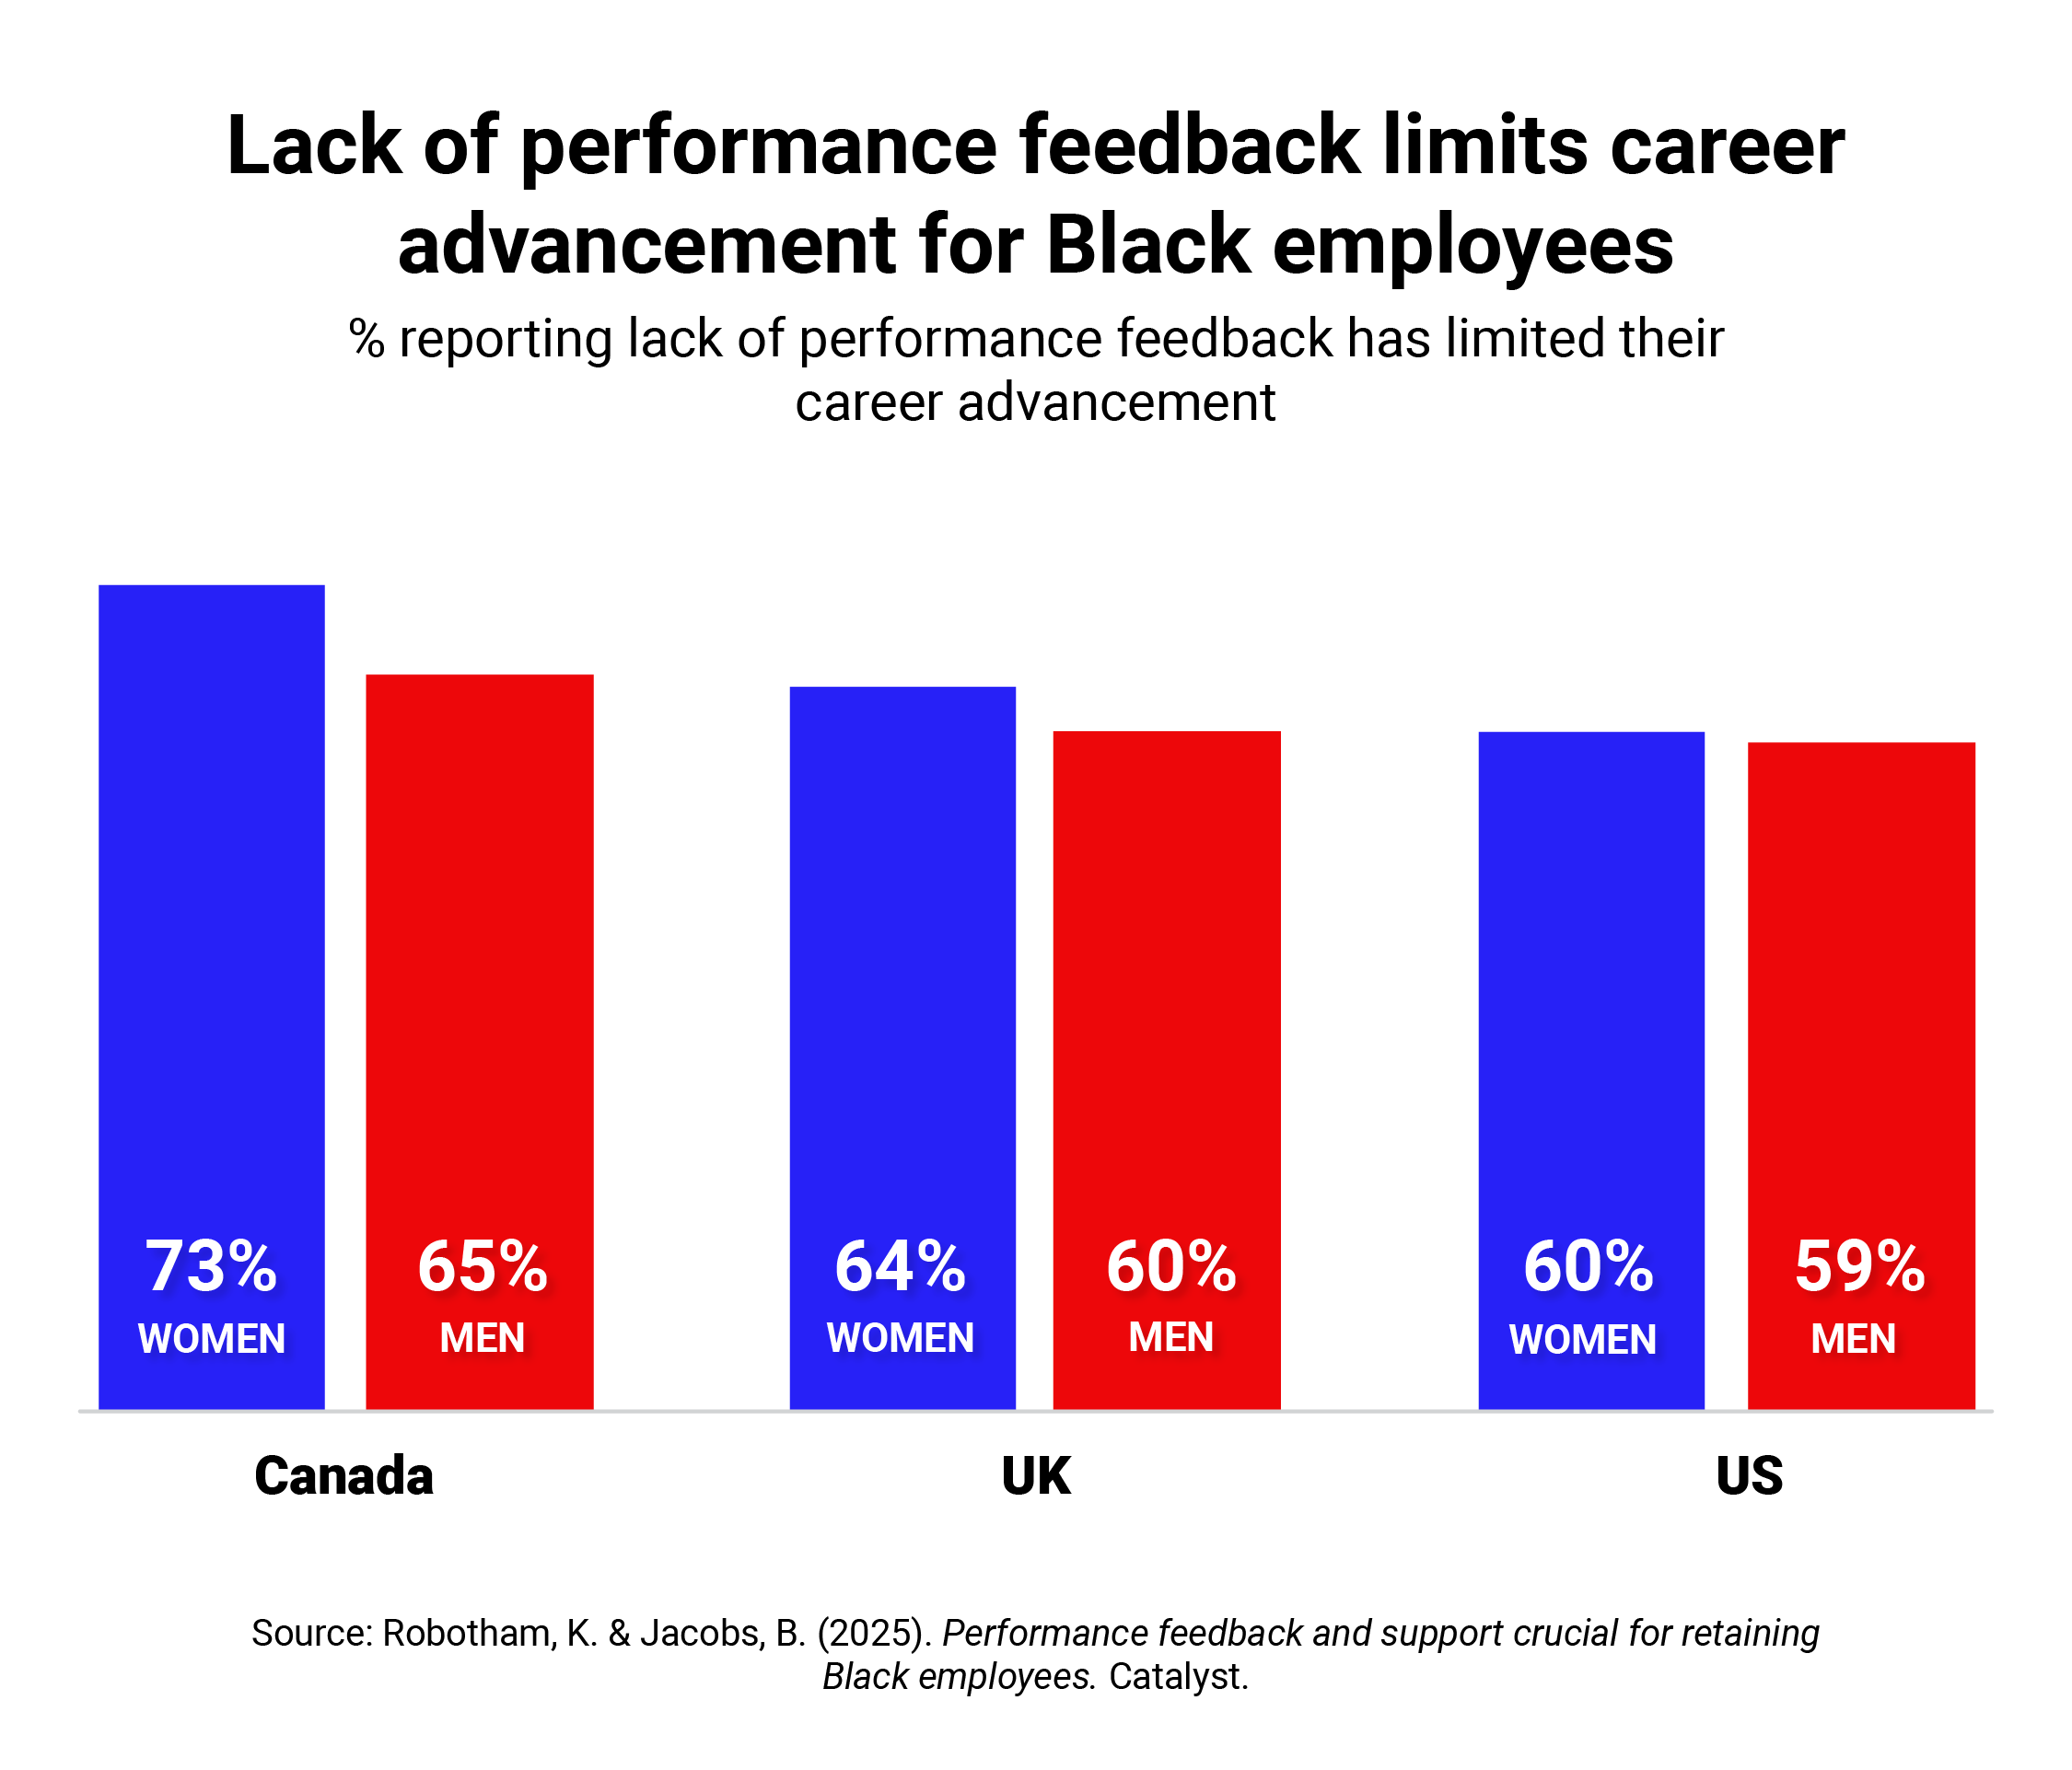
A Catalyst survey of 508 Black employees from Canada, the United Kingdom, and the United States finds that a majority in all three countries report their careers have suffered due to a lack of support from leaders.1 In particular, Black employees regardless of gender say that their advancement has been limited because they lack mentors and sponsors and they do not receive sufficient performance feedback.2
How to cite: Robotham, K. & Jacobs, B. (2025). Performance feedback and support crucial for retaining Black employees . Catalyst.
Black employees who lack support are more likely to intend to leave their job
This matters because talent managers and business leaders work hard to retain a talented and diverse workforce — especially given the high cost of turnover — but their efforts are jeopardized when employees are not properly supported by managers and other colleagues. Our research shows that when Black employees are left wanting for mentorship and sponsorship or for performance feedback, they are more likely to intend to leave their jobs3 — which can have serious costs in terms of budget, business continuity, and team performance.
- Black employees who say lack of mentorship and sponsorship has limited their career advancement are twice as likely to have high turnover intentions compared to those who say lack of mentorship has not limited their career advancement.
- Black employees who say lack of performance feedback has limited their career advancement are 1.5x times as likely to have high turnover intentions compared to those who say lack of performance feedback has not limited their career advancement.
In their own words
Black employees gave us examples of how these issues play out at work.4

“I was not given the same opportunities and large roles as my colleagues, and I felt not listened to.” — Black UK Woman, 36 years old
“It's a recurring thing. At several management meetings, I give my ideas about project issues, but they get either 'ignored' or dismissed. Later the same management staff and supervisor, who are White, will use my ideas and run with them as their own ideas.” — Black US Man, 62 years old
“I was not offered some roles because of my race, as the company felt customers wouldn't want to associate with their brand based on my race.” — Black UK Man, 37 years old
“Usually happens when applying for job positions. Most excuses were other qualified applicants — majority White males fresh out of university landed the position. One time I applied to a job for experience, they offered it to me and delayed the opportunity for 4+ months only to tell me they were not going to advance me but promised me training opportunities for the future, which didn't happen.” — Black Canadian Woman, 38 years old
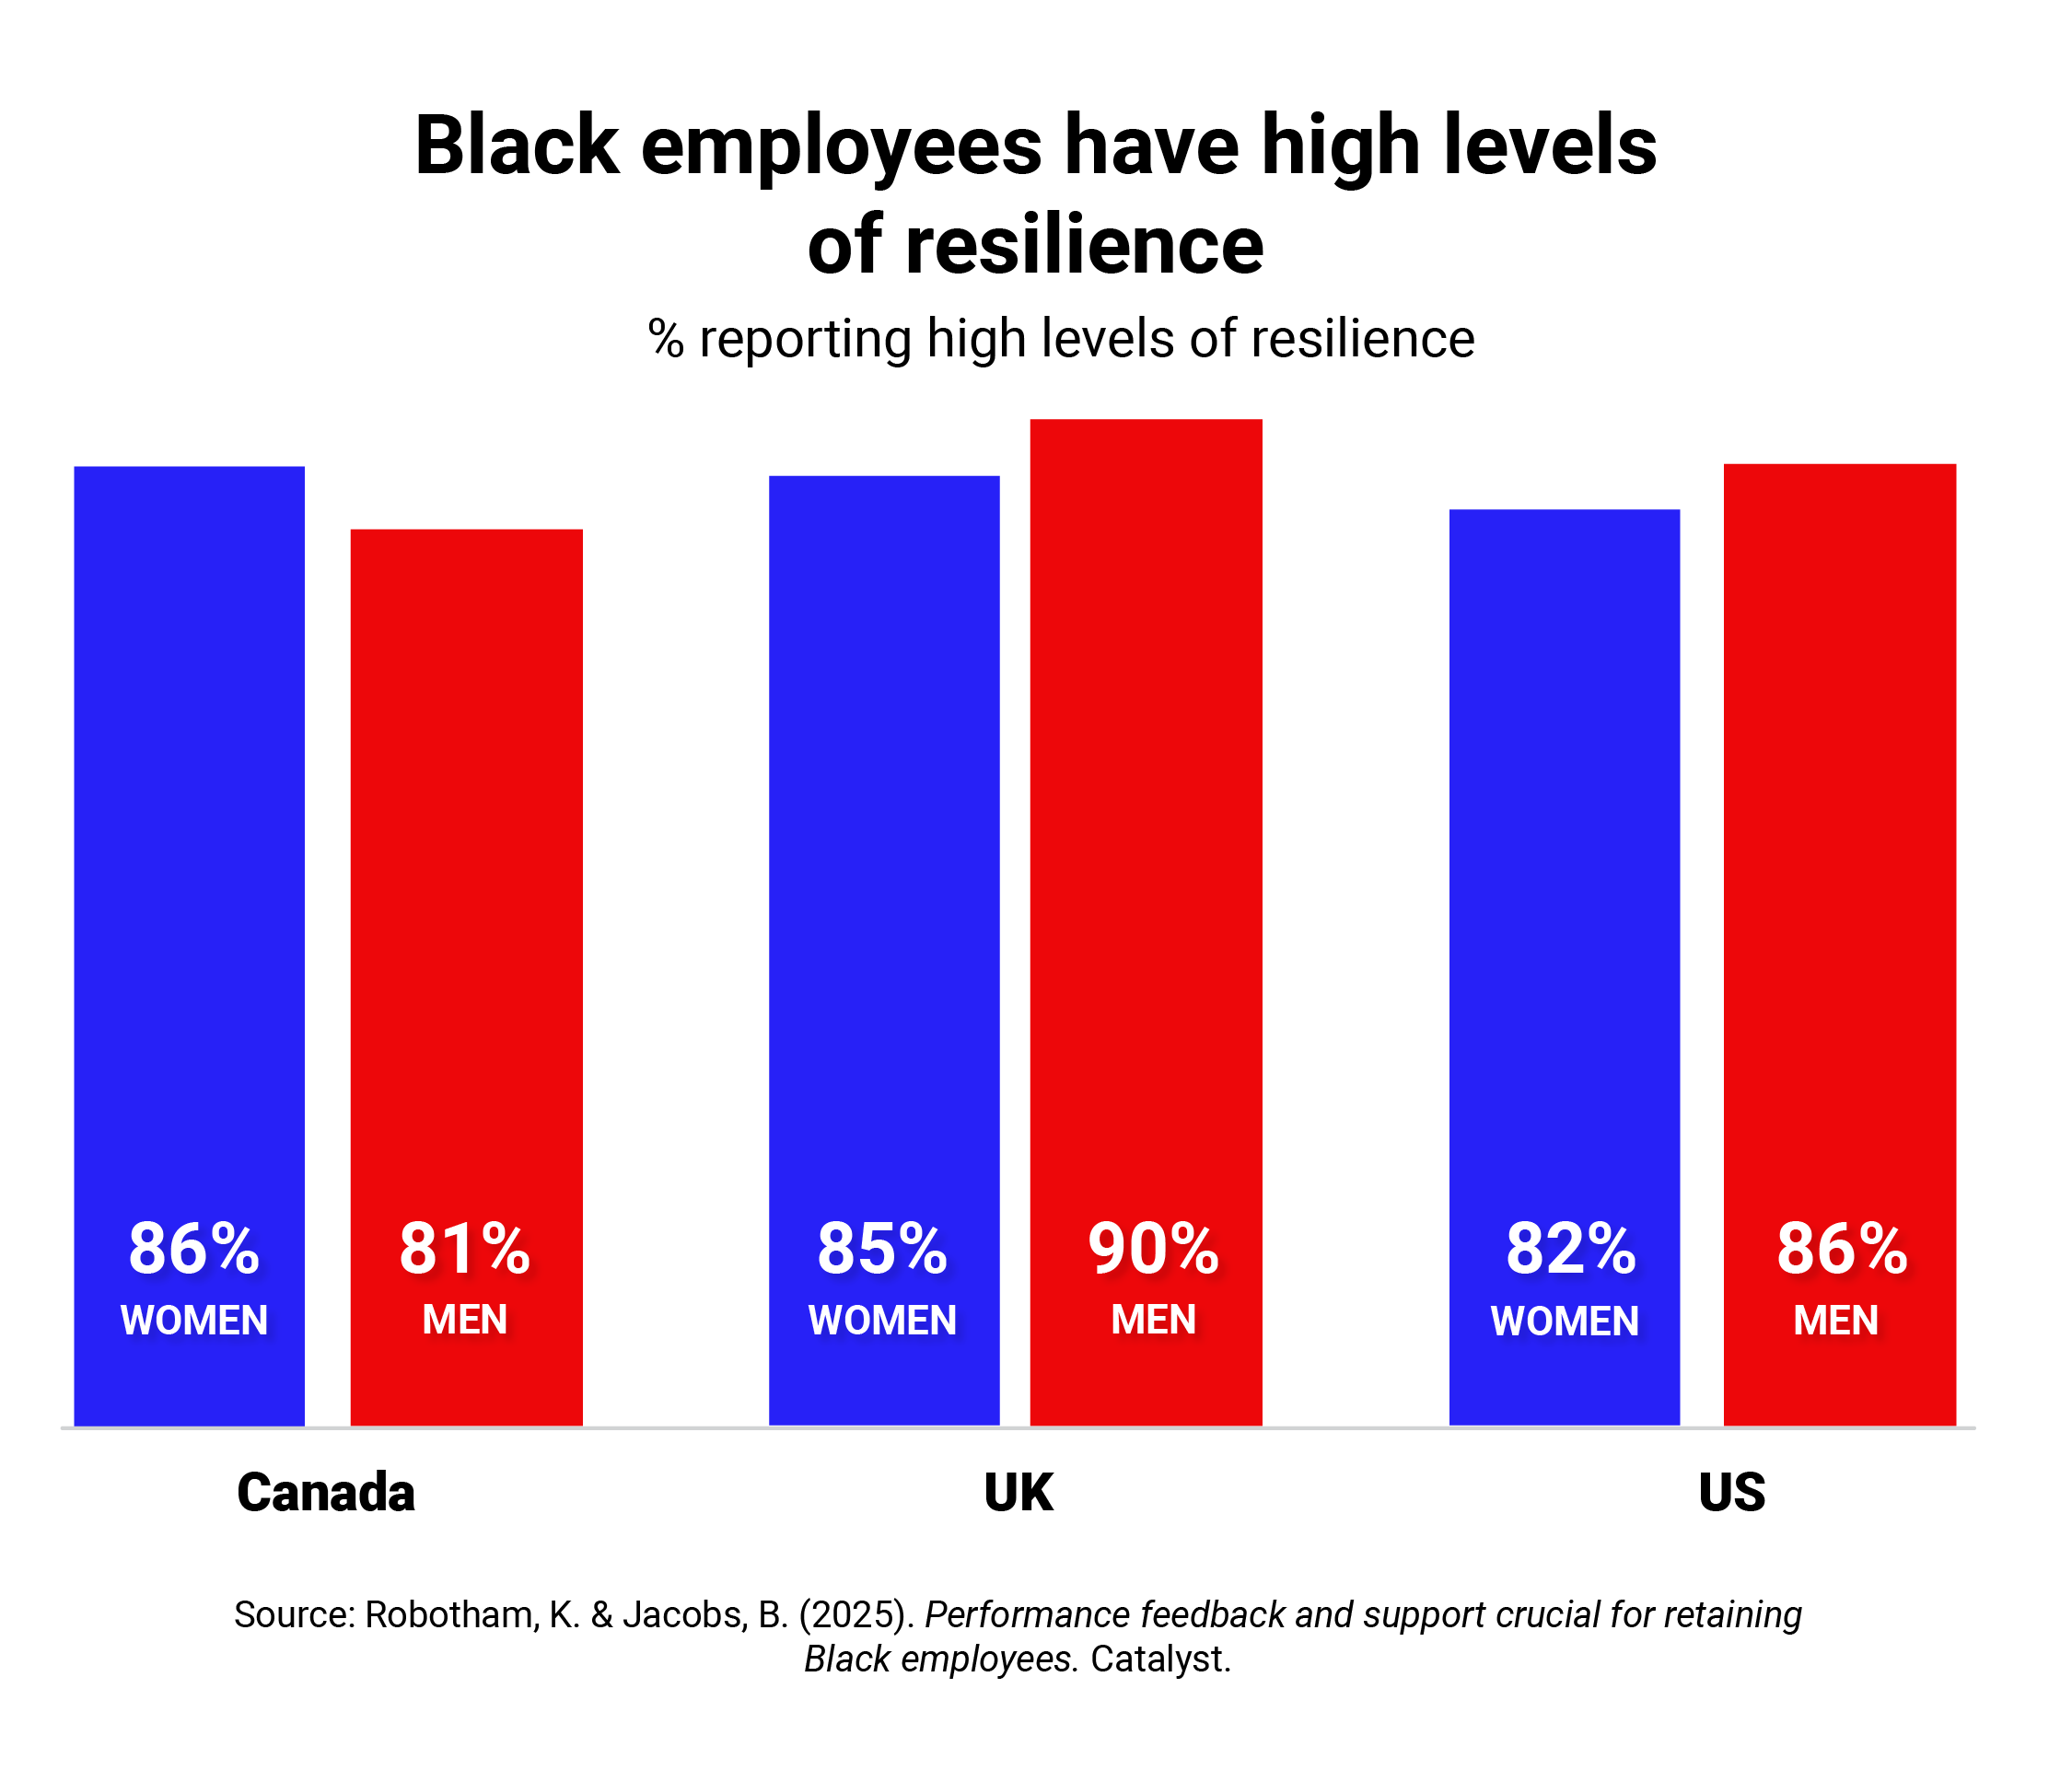
Black employees are resilient despite barriers to advancement
Black employees demonstrate significant resilience in the face of these barriers to advancement and other workplace challenges. In all three regions, over four out of five Black employees across genders have high levels of resilience despite — or perhaps in part because of — the difficulties they have encountered.5
Resilience is a critical workplace skill, as it enables employees to persevere in the face of setbacks, remain flexible during times of change, and approach problem-solving with determination.6 While these qualities can help Black employees navigate complex situations and drive innovation, resilience alone cannot counteract the detrimental effects of poor feedback, lack of mentorship, and limited sponsorship.7 Organizations that provide support to close these gaps can better harness the strengths of Black employees while preventing burnout and improving retention and advancement.
The bottom line
Black employees do not advance into leadership at the same rates as their White colleagues.8 Our research shows this is partially due to lack of support from leadership and managers, specifically poor mentorship and sponsorship and performance feedback. Organizations that aspire to distribute career advancement opportunities fairly across all qualified employees must ensure that everyone is receiving the support that they need. Otherwise, they risk losing Black talent to other organizations.
Take action: HR and talent leaders
HR and talent management leaders can take the following steps to start creating more opportunities for Black employees to get the support they need to succeed. Note that these recommendations are good practice for all employees — the key is making sure that all employees are actually benefiting from them.
Audit your performance feedback processes for bias
Examine your organization’s performance data
Address disparities
Avoid bias
Develop a sponsorship program
Understand and identify the relevant sponsorship needs at your organization
Get leadership buy-in
Establish a framework for the program
Take action: Managers
Managers can take the following steps to start creating more opportunities for Black employees to get the support they need to succeed. Note that these recommendations are good practice for all employees — the key is making sure that all employees are actually benefiting from them.
Provide regular constructive feedback
Schedule quarterly feedback sessions
Base feedback on specific behaviors
Engage in two-way feedback
Be a sponsor
Start sponsoring someone
Be an advocate
Hold yourself accountable
Endnotes
- We surveyed 508 Black employees from Canada (n = 51), the United Kingdom (n = 197), and the United States (n = 260). Among the sample, 265 were women, 212 were men, 30 were transgender or nonbinary and 1 preferred not to answer. The top five industries represented in the sample were administration/general management (17%), finance/accounting/purchasing (13%), healthcare delivery (8.5%), operations management/manufacturing (8.5%), and computer/information systems management (6.9%). Participants were between the ages of 19 and 75 years old. On average, participants were 36 years old.
- Participants were asked to what extent lack of mentorship and sponsorship has limited their career advancement and could respond on a scale of 1 to 7 with higher scores (4 to 7) indicating that it was more limiting to their career. A chi-square analysis revealed that the percentage of Black employees in Canada who report that lack of mentorship and sponsorship has limited their career advancement did not differ significantly by gender, Χ2 (1) = .67, p = .413. A chi-square analysis revealed that the percentage of Black employees in the United Kingdom who report that lack of mentorship and sponsorship has limited their career advancement did not differ significantly by gender, Χ2 (1) = .46, p = .497. A chi-square analysis revealed that the percentage of Black employees in the United States who report that lack of mentorship and sponsorship has limited their career advancement did not differ significantly by gender, Χ2 (1) = .39, p = .533. Participants were asked to what extent lack of performance feedback has limited their career advancement and could respond on a scale of 1 to 7 with higher scores (4 to 7) indicating that it was more limiting to their career. A chi-square analysis revealed that the percentage of Black employees in Canada who report that lack of performance feedback has limited their career advancement did not differ significantly by gender, Χ2 (1) = .30, p = .584. A chi-square analysis revealed that the percentage of Black employees in the United Kingdom who report that lack performance feedback has limited their career advancement did not differ significantly by gender, Χ2 (1) = .26, p = .607. A chi-square analysis revealed that the percentage of Black employees in the United States who report that lack of performance feedback has limited their career advancement did not differ significantly by gender, Χ2 (1) = .00, p = .965.
- Turnover intentions (1 item) were measured on a scale of 1 to 7. Scores of 4 to 7 reflect high levels of turnover intentions. A logistic regression was conducted to examine whether a lack of mentorship and sponsorship limiting career advancement predicts turnover intentions. The logistic regression was statistically significant: X2 (1) = 9.90, p = .002, Nagelkerke R Square = .03. When employees report that a lack of mentorship and sponsorship has limited their career advancement, they are two times more likely to report high turnover intentions, b = .66, Exp(B) = 1.93, p = .002. A logistic regression was conducted to examine whether lack of performance feedback limiting career advancement predicts turnover intentions. The logistic regression was statistically significant: X2 (1) = 4.53, p = .033, Nagelkerke R Square = .01. When employees report that a lack of mentorship and sponsorship has limited their career advancement, they are 1.5 times more likely to report high turnover intentions, b = .44, Exp(B) =1.54, p = .033.
- Word of voices research series (2022). [Unpublished data]. Catalyst.
- Resilience (α = .91) was measured using the average of 10 items on a scale of 1 to 7. Scale scores of 4 to 7 reflect high levels of resilience. A chi-square analysis revealed that the percentage of Black employees in Canada who report that high levels of resilience did not differ significantly by gender, Χ2 (1) = .27, p = .604. A chi-square analysis revealed that the percentage of Black employees in the United Kingdom who report high levels of resilience did not differ significantly by gender, Χ2 (1) = 1.16, p = .282. A chi-square analysis revealed that the percentage of Black employees in the United States who report high levels of resilience did not differ significantly by gender, Χ2 (1) = .65, p = .421.
- Rainey, C. (2023, July 11). Building resilience in the workplace: Strategies for success. Forbes.
- King, D. D. & McSpedon, M. R. (2022, June 17). What leaders get wrong about resilience. Harvard Business Review.
- Pong, C. (2024, November 17). Closing the leadership gap for people of color. Forbes.
- Language bias in performance feedback. Textio.
- Language bias in performance feedback. Textio.
- Petsko, C. D. & Rosette, A. S. (2023). Are leaders still presumed White by default? Racial bias in leader categorization revisited. Journal of Applied Psychology, 108(2), 330–340; Rosette, A. S., Leonardelli, G. J., & Phillips, K. W. (2008). The White standard: Racial bias in leader categorization. Journal of Applied Psychology, 93(4), 758–777.