Key Findings: The Convergent Leader: A new model for sustaining growth through disruption
45 min read
| Updated ; first published
Joint CEO foreword
Ten years from now, when we try to pinpoint the tipping point of artificial intelligence (AI)-driven workforce transformation, the moment might just be coincident with the kick-off of this research in August 2025, one year before the EU Artificial Intelligence (AI) Act was slated to go into full effect.
Geopolitical and economic uncertainty, rising energy costs, and climate adaptation obligations had compelled leaders in Europe to cut investments in workplace culture and employee engagement. Closing the productivity gap with the US and Asia demanded they accelerate investment in AI, as growth depended on its implementation at scale. How the workforce would effect that transformation, no one knew.
As two organisations grounded in decades of workforce research and inclusion expertise, we made it our business to find out. Catalyst, drawing on more than 60 years of research and practical solutions to help build workplaces that work for women and for everyone, brought a clear gender lens alongside Europe-based staff and regional context. Coqual, with its decades of research and ongoing work with multinational companies through global labs and a Europe-based community of practice, brought insight into how inclusion and innovation are shaped inside organisations. Together, we knew we had the analytical expertise to mount a robust inquiry into why inclusion may matter more, not less, as technology transforms the very nature of work. We launched our joint research with a three-country survey of leaders and employees, paired with extensive interviews, and anchored it all in a strong inclusion lens, including regionally relevant, identity based questions and analysis, to build a deeper understanding of how AI technologies are shaping European workforces.
Yet as you will see, the story that emerged does not break along demographic lines. It speaks, rather, to what all workers need as AI takes over tasks, redesigns workflows, and rewrites the org chart: a new kind of leadership. The behaviours, skills, and mindset that historically have supported marginalised and underrepresented groups are what everyone needs to thrive in an AI-enabled workplace.
This is not to say we believe Diversity, Equity, and Inclusion (DEI) no longer matters. Bias is baked into AI technologies. Advantage concentrates on those privileged with access. Disadvantage accrues to those who historically have faced greater scrutiny and been met with less tolerance for error. As companies begin to track the impact of AI on workers, we could see the most vulnerable and marginalised members of the workforce disproportionately affected.
But then again, maybe not. Because organisations are at an inflection point: if leaders practice the flexible mindset, AI skills, and inclusive behaviours our data reveal to be paramount to successful transformation, they will accelerate not only business growth, but the growth and development of their people, irrespective of demographic.
The following report details how to seize this historic moment. It’s both a guide for leaders and a blueprint for organisations to build the future we collectively want and need.
And that building must begin right now.
Jennie Glazer, CEO of Coqual
Jennifer McCollum, President & CEO of Catalyst
How to cite: Key findings: The Convergent Leader: A new model for sustaining growth through disruption. (2026). Catalyst and Coqual.
Introduction
Europe’s business leaders, like their counterparts elsewhere, are investing heavily in transformational technologies like artificial intelligence (AI) to drive growth. But whether this strategy unlocks AI’s growth dividend will depend, in large part, on whether the people whom leaders are counting on to do the automating and augmenting are empowered – and willing – to do so.
Focusing our inquiry on three illustrative markets, France, Germany, and the United Kingdom (UK), we set out to learn how organisations can achieve the technological transformation promised by AI. Organisations, the data reveal, are at an inflection point. Headlong investment in AI has ostensibly delivered them to the threshold of technological transformation. But for AI to deliver on its considerable growth potential, leaders must now prioritise how they engage, develop, and incentivise their people alongside the technology.
We see this as a momentous opportunity for large organisations: by empowering employees to be co-creators of their AI-enabled future, organisations can secure the trust, ingenuity, and diversity that unlock innovation and sustain growth.
Our findings also suggest that empowering the workforce in this transformation will require a new kind of leadership characterised by AI skills, inclusive behaviours, and a flexible mindset defined by relentless curiosity, grace under fire, and human-centred judgement.
Read the full report
If your organization is a Catalyst Supporter, you can download the full version of The Convergent Leader: A new leadership model for sustaining growth through disruption to learn more about leading AI adoption that builds trust, protects inclusion, and delivers measurable performance.
What’s blocking AI-enabled growth
Across the organisations we studied, we found leaders under intense pressure to make major artificial intelligence (AI) investments deliver growth, especially as market headwinds suppress it. In that push for transformation, however, the human work of leading people through change has been deprioritised. Employees are being asked to experiment, adapt, and carry transformation forward, often without direction, protection, or support. The result? A widening gap between what leaders expect from employees and what employees are willing and able to deliver as AI reshapes their work.
What we learned from leaders
Not everyone is given access to AI tools and training.
Licenses are expensive, leaders explained, as are training modules. Yet they could not articulate a rationale for who warranted access.
Upskilling in AI is discretionary.
Leaders expect users to learn and practice on their own, as time permits. Only about one in three employees (35%) say their organisation helps them build AI skills relevant to their role.1
Responsible AI is seen as an inhibitor of growth rather than a driver.
About three in five leaders (61%) say their organisation has a responsible AI policy,2 yet leaders we interviewed said RAI is perceived as yet another stifling constraint that slows adoption, innovation, and productivity.
Most leaders (95%) cannot quantify the impact of AI because their organisations are not tracking it.3
Some are struggling to come up with appropriate metrics, whereas others don’t see tracking impact as a priority investment.
Rather than hire junior talent, organisations are ceding entry-level positions to AI.4
Leaders are conscious of the disruption this bodes for the talent pipeline; they’re also concerned about AI dependence supplanting opportunities for junior talent to develop and hone judgement, critical thinking, and human interaction skills. But they’re not inclined to hire junior talent or protect these roles.
What we learned from employees
Employees are feeling anxious about AI – especially about its impact on their future
‘The chats in my network are like, “When is that sword going to cut my head off?” in a jokey but not-so-jokey kind of way. That’s pretty much talked about constantly.’
– Senior inclusion manager, global technology platform
Employees feel left out of the AI conversation.
Only one in three employees (33%) feel their organisation effectively communicates the impact of AI adoption.7
Employees recognise that leaders may not have all the answers they seek, but would nonetheless appreciate being told what leaders do know.
Employees are mistrustful of leadership.
Employees don’t trust AI to improve their work or safeguard their data.
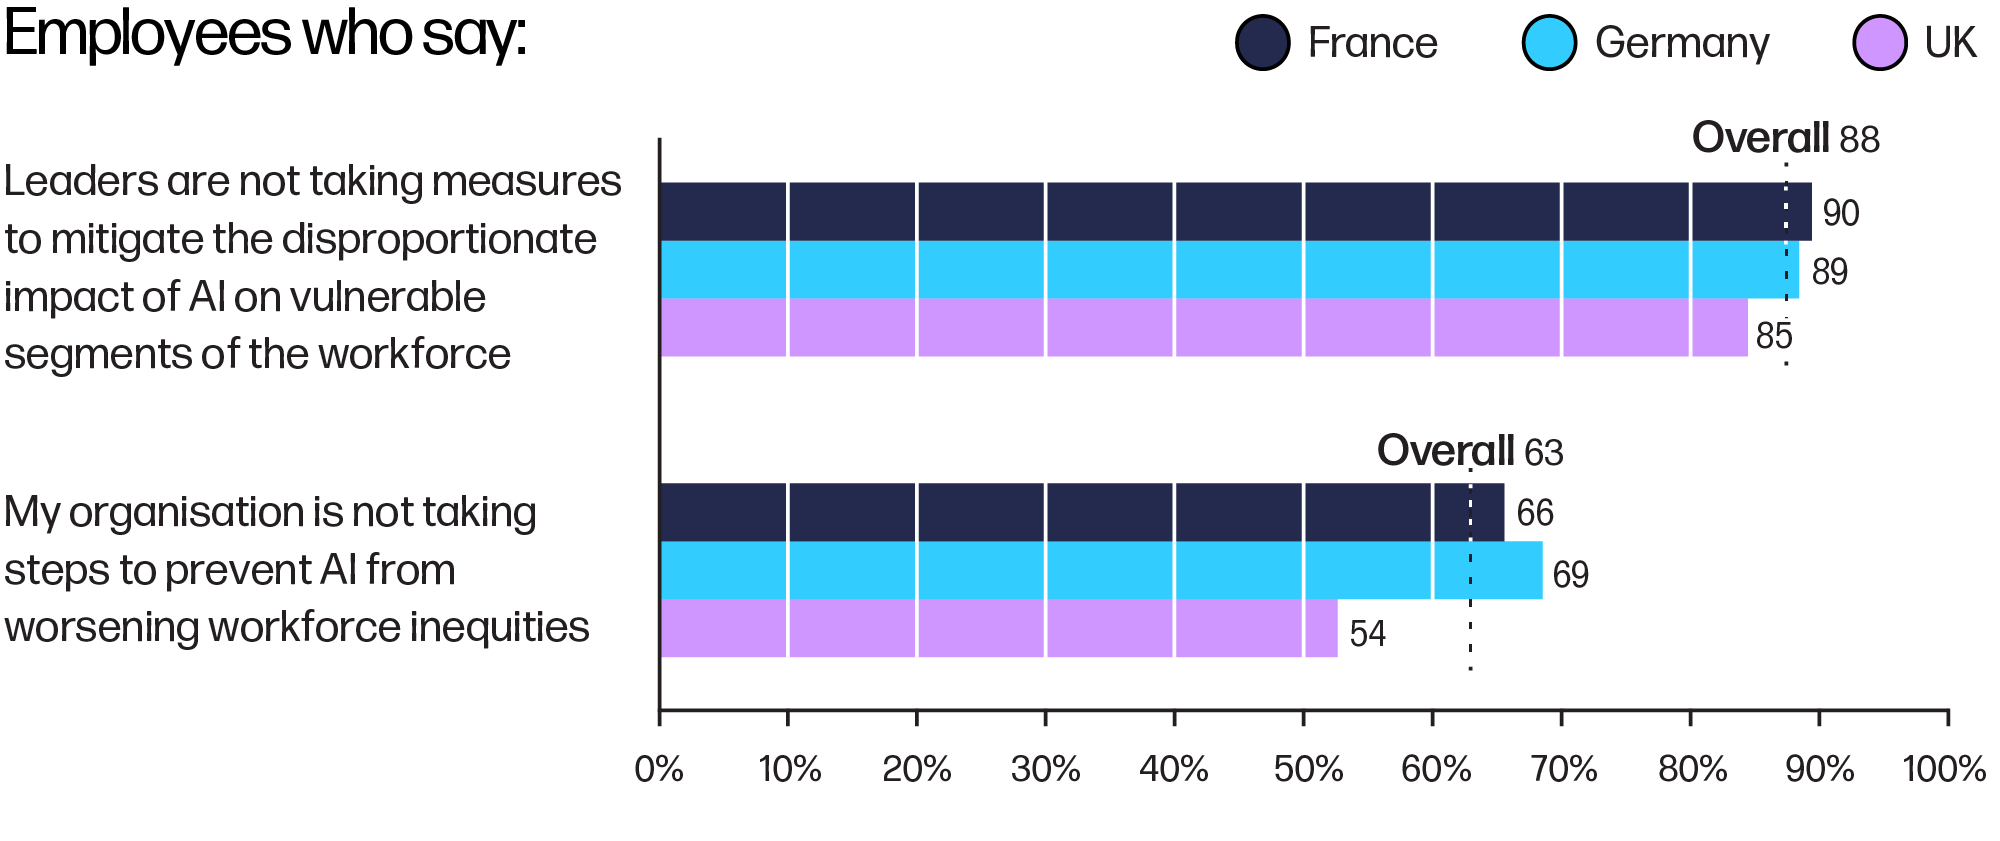
Employees are cynical about leaders’ commitment to inclusion.12
Nearly four in five employees (78%) disagree that leaders at their organisation are making efforts to create a more inclusive culture.13 In the last 18 months, the emphasis has shifted, interviewees told us, from an ethos of support to a survival-of-the-fittest mentality.
Implications for organisations
Taken as a whole, our qualitative and quantitative findings suggest a profound disconnect between what leaders expect and what employees anticipate.
Leaders are looking to employees to drive AI adoption. But by making tools and training available unevenly,14 they are conferring a powerful advantage on some while potentially disenfranchising others, most likely women, people of colour, and other marginalised populations.15
Moreover, we see that leaders are not including employees in discussions about AI16 nor soliciting their input to inform decisions about it.17 In the absence of communication from the top, employees are thus left to imagine what AI’s implementation might mean for them. Consequently, employees are anxious, mistrustful, fearful, and cynical, sentiments that contribute to disengagement, burn-out, and brand-damaging public criticism.18
By keeping employees in the dark about their plans for AI, shifting responsibility for outcomes and risk mitigation to employees, and shortchanging talent development, leaders are backing away from the true demands of leadership. As a result, employees feel insecure to the point of withholding trust, commitment, and collaboration.
This dynamic suggests why investment in AI alone does not automatically translate into adoption and ultimately growth. But there’s another way forward, wherein leaders accelerate and more firmly direct the transformation they envision.
Unlocking growth: what’s required of leaders
What kind of leadership regains the trust of employees and harnesses their ingenuity to unlock AI’s potential? Who do Europe’s leaders need to become to drive growth despite economic uncertainty, political realignment, tightening regulation, and a shrinking and ageing workforce?
We find that effective leadership comprises capabilities across three domains, and have dubbed those who excel in these areas as Convergent Leaders.19 Roughly one in three leaders (37%) today, we find, demonstrates this convergence of capabilities.
AI skills
- Understanding how AI systems operate .
- Identifying potential use cases for AI within their function and/or role to drive bottom-line impact.
- Upskilling regularly in tool usage, responsible AI, and strategic AI.
Inclusive behaviours
- Providing equal support for all team members.
- Creating space for everyone to speak up and be heard.
- Making it safe to propose new or risky ideas.
- Giving clear, actionable feedback.
- Seeking out differing perspectives for consideration.
- Empowering team members to make their own decisions.
- Taking ownership of mistakes .
- Holding team members accountable for their behaviour and performance.
Flexible mindset
- Cognitive flexibility20: able to execute in the present while simultaneously strategising for what comes next.
- Relentless curiosity: inclined to question assumptions, experiment in pursuit of new solutions, and constantly seek out opportunities to hone their knowledge, skills, and practices.21
- Grace under fire: staying calm, decisive, and supportive amidst uncertainty or ambiguity.22
- Human‑centred judgement: inclined to prioritise the ‘soft’ skills (creativity, cultural intelligence, openness, and flexibility) as well as the ‘hard’ (analytical thinking, technological literacy, and data fluency)23 in how they assess, develop, and manage talent for future success.24
The Convergent Leadership model
Convergent leaders embody a capability stack that combines AI skills, inclusive behaviours, and, critically, a flexible mindset that serves to both integrate and strengthen the impact of inclusive and AI capabilities.25
AI skills
Leaders who build AI capability by understanding how it works, identifying use cases, and continuously upskilling in tools, responsible use, and strategic application.
" As a leader, you need understand what AI means continuously – not, “I got one training and I know what I’m talking about.” It’s just way too complex."
- C-suite leader, multinational insurance firm
Inclusive behaviours
Leaders who foster an inclusive, safe, and accountable team environment where everyone’s voice is heard, innovation is encouraged, and ownership and feedback drive performance
"The use of AI will benefit from diverse perspectives. So I look for someone who could bring a very specific perspective to prompting AI, and by this, shape its output."
– Inclusiveness leader, global professional services firm
Flexible mindset
Leaders who demonstrate cognitive flexibility, relentless curiosity, and grace under fire, using human-centred judgment that balances soft and hard skills to navigate uncertainty and develop talent for the future.
"Curiosity and adaptability are the two key capabilities for the AI era. Curiosity because we should always be optimising what we do and the way we do it. And adaptability because change is a constant. Any mindset now that isn’t flexible will struggle."
- Chief data officer, business media organisation
The power of Convergent Leadership
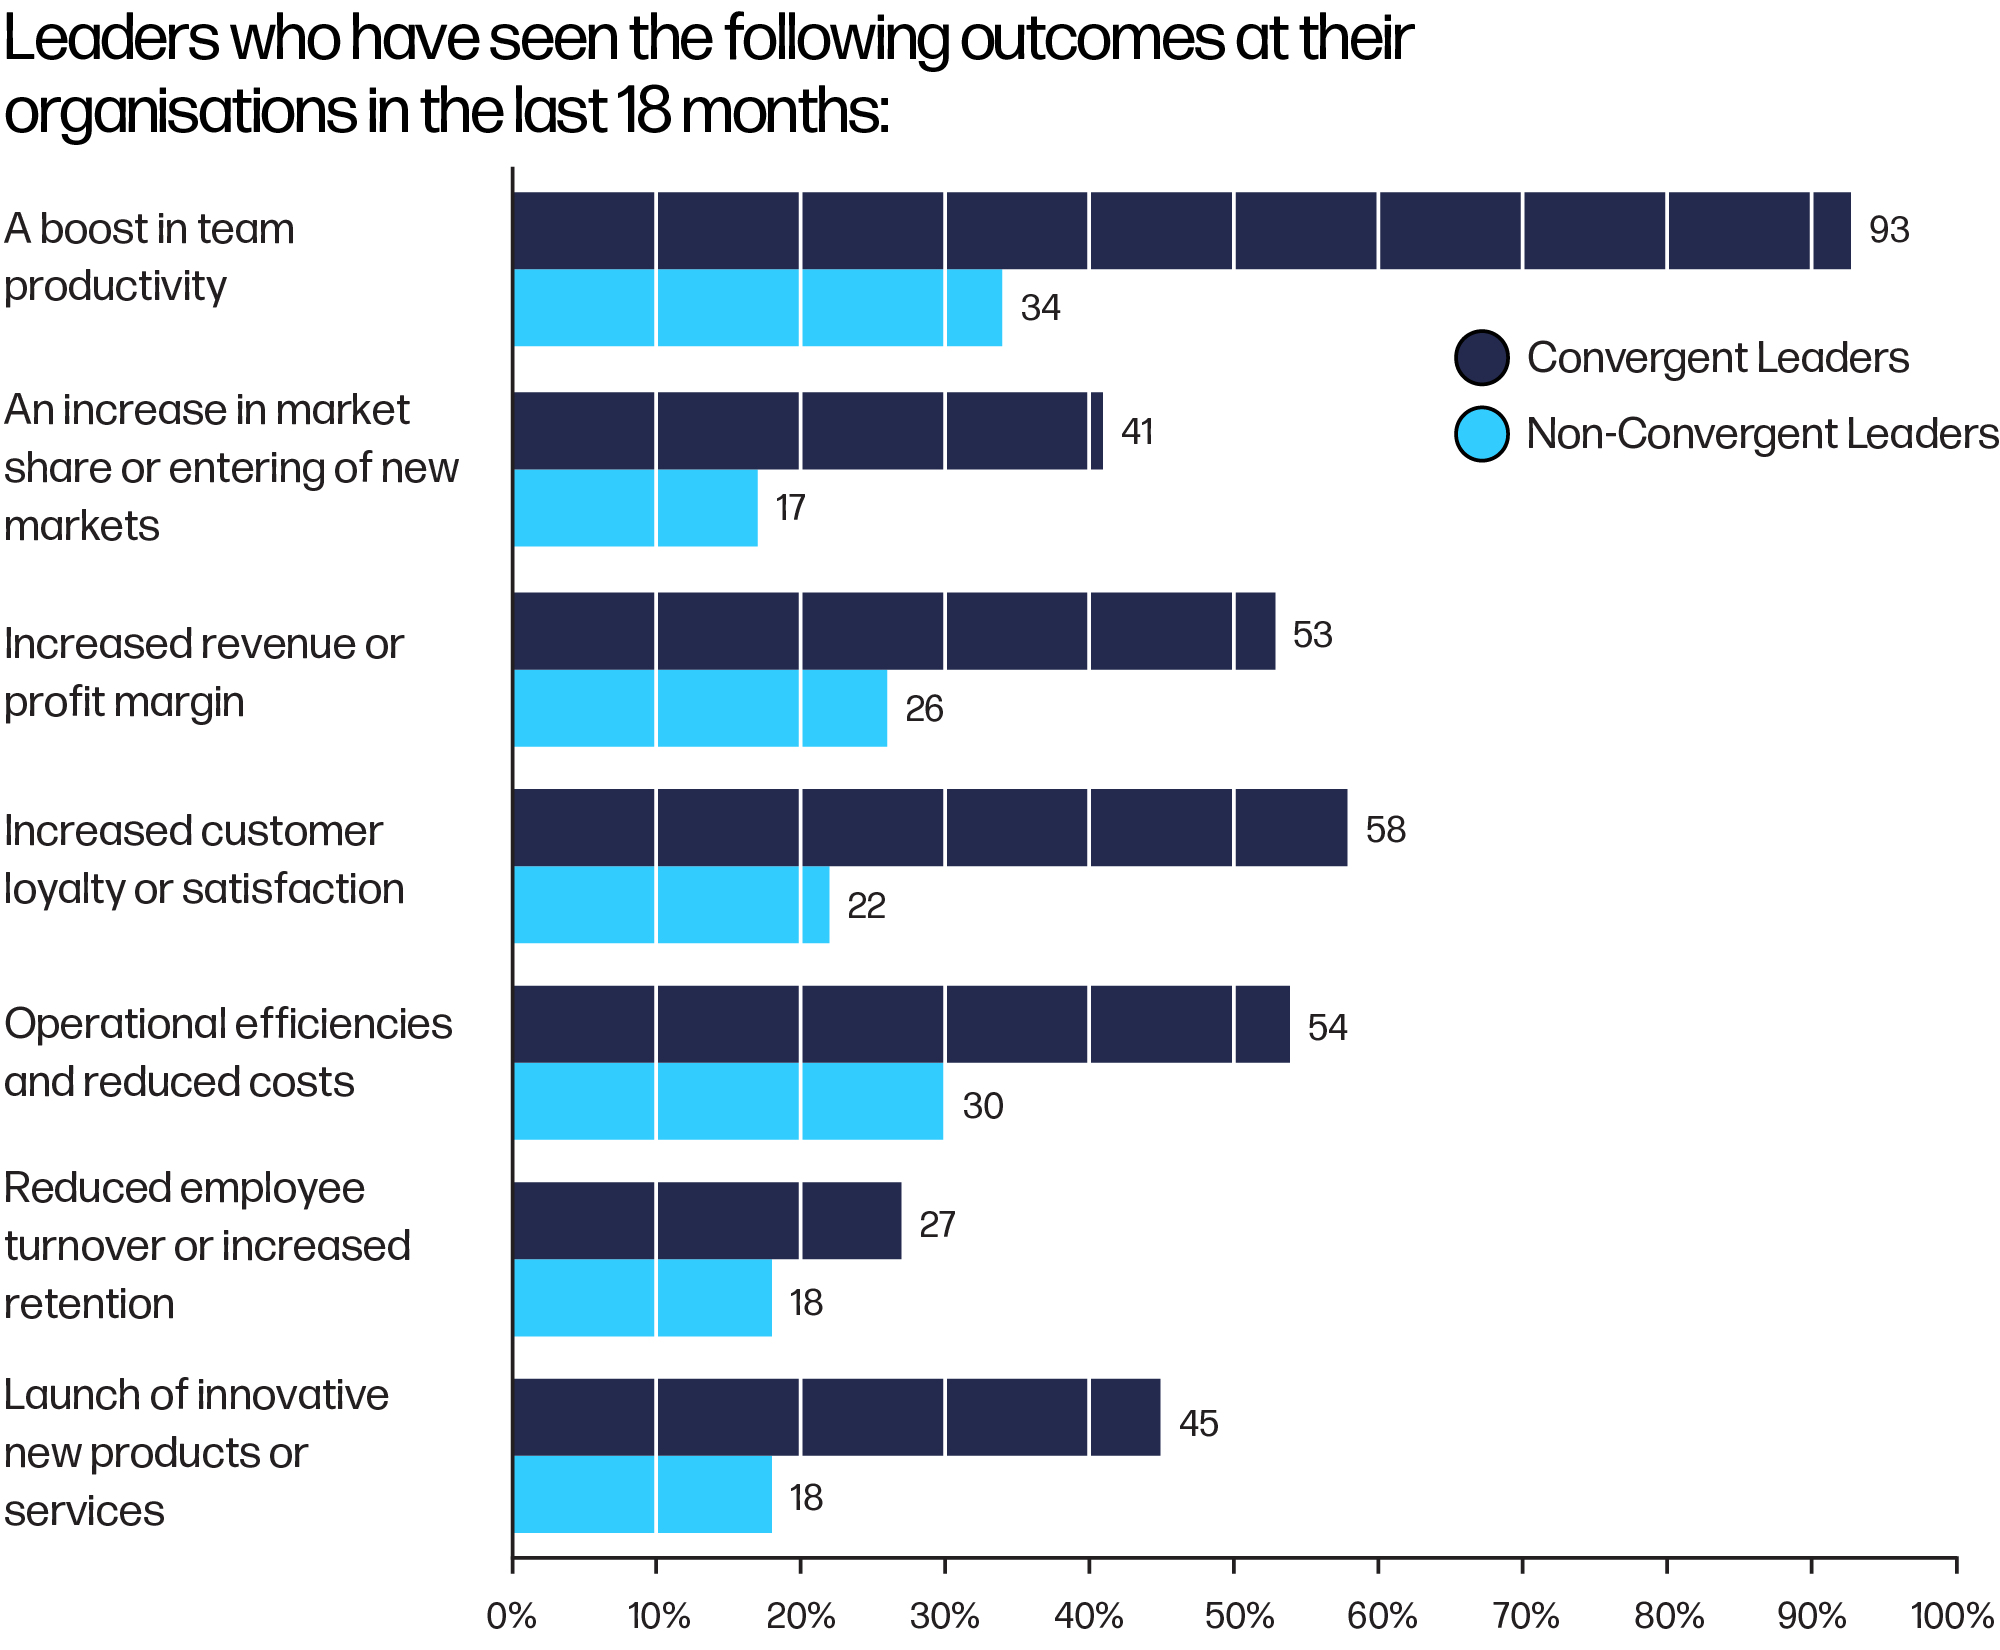
When we compare the outcomes for Convergent Leaders against non-Convergent Leaders, the impact is striking. Across core business indicators, including innovation, growth, and efficiency, organisations led by organisations led by Convergent Leaders consistently outperform their peers.26
Convergent Leaders impact more than business performance, however. They also drive workforce engagement27 and readiness for AI-driven change.28
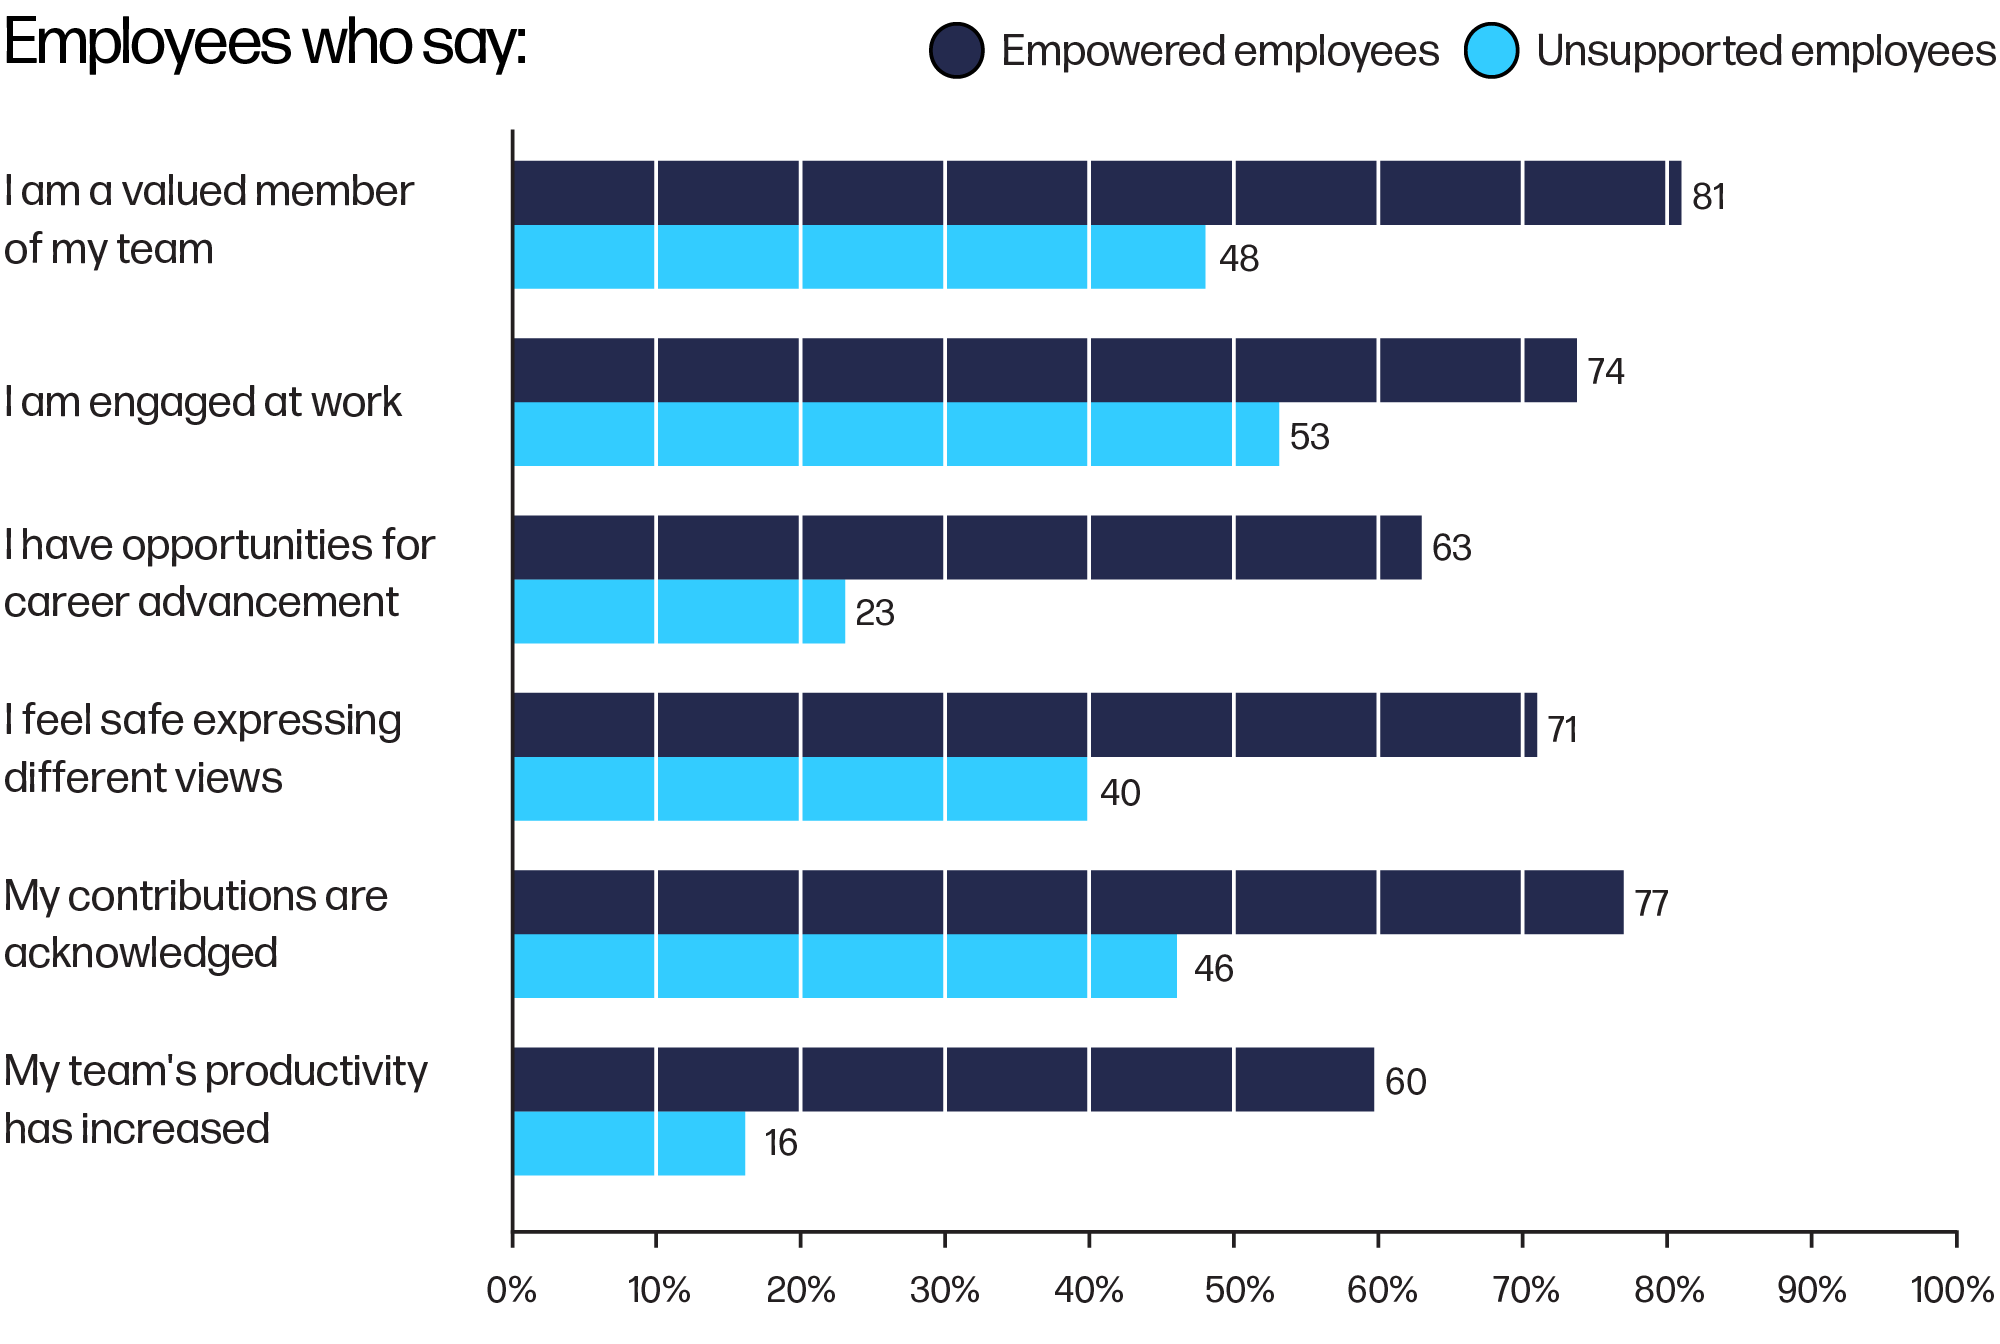
Our data sorted our employee sample into two groups, facilitating a comparison:29
- Empowered – those who perceive their leaders to be inclusive, adaptable, transparent, and active in their engagement of employees in the AI adoption process, aligning with our definition of Convergent Leaders (58%)
- Unsupported – those who did not perceive their leaders as inclusive or inclined to ready them for responsible AI adoption (42%)
How to Cultivate Convergent Leadership
In our full report, we outline the following key tenets for organisations, complete with tangible steps leaders and practitioners can take immediately, and long-term plans they can begin today.
To amplify growth, organisations must create the conditions that address the impediments we have surfaced in data and in conversations with business leaders in Europe.
- Keep employees informed
- Make responsible AI part of everyday work
- Treat employees as partners in AI outcomes
- Rethink entry-level roles and early careers in an AI-enabled workplace
- Use data to understand AI’s impact on people and work
Conclusion
The skills, behaviours, and mindsets that support marginalised groups are what everyone needs to thrive amidst disruption, including the seismic one we're experiencing as AI transforms our work and our lives. Whether AI investments deliver durable growth will depend less on the technology and more on how leaders govern change and lead people through it.
Convergent Leadership offers a practical path forward. It does not require organisations to slow AI adoption or launch new initiatives. It requires leaders to activate capabilities many already possess - AI skills, inclusive behaviours, and flexible mindset - and apply them in parallel with ongoing business transformation. In doing so, leaders create the conditions that encourage and equip employees to learn, experiment, and take the collective risks that enterprise-wide change demands.
Europe’s leaders have a choice to make: they can continue to allow AI transformation to unfold unevenly and reactively. Or they can exercise the human-centred leadership that restores trust and drives progress. Either way, AI will continue to reshape work. But only by empowering the people who are doing that work – upholding Europe’s tradition of protecting human dignity – will leaders unleash the power of AI to augment human ingenuity, accelerate innovation, and sustain market growth.
Methodology
Study design and participants
We used a mixed methods design consisting of interviews and self-report surveys. Data were collected in October and November 2025. In total, we surveyed 2,891 business leaders and employees from France (34%), Germany (31%), and the UK (35%). Of the overall sample, 34% were business leaders and 47% were women. The best represented industries were Finance and Professional Services (24%), Manufacturing and Engineering (15%), and Healthcare and Pharmaceuticals (11%). These are largely reflective of the biggest industries of the represented countries.
Separately, we collected qualitative insights from a total of 31 individuals: this included executives, function leaders, and team leaders at multinationals headquartered in Europe, and subject-matter experts in AI, talent management, information technology, and data science. Interviews were conducted between October 2025 and January 2026.
Materials and procedures
Survey participants were asked about their skills, mindsets, and behaviours related to AI. Questions were measured using a combination of Likert rating scales and binary outcomes. Leader and employee items were not always identical, as each was designed to reflect the unique demands and expectations of their respective roles, but in many cases were complementary. Data were collected through an online platform, and analyses were conducted using IBM SPSS Statistics.
Qualitative insights were collected in the form of semi-structured interviews. Names of interviewees throughout the report and key findings were changed to preserve the anonymity of participants.
Data analysis
We explored our research questions using a combination of statistical techniques including regression and chi-square analysis to test relationships between individual skills, mindsets, and behaviours and AI or organisational outcomes. T-tests and ANOVA techniques were used to investigate differences between skillsets, regions, and demographic groups. For some research questions, clustering and factorial analysis were used to achieve construct validity before proceeding with the analytical techniques. Findings were evaluated based on their significance levels (p ≤ .05), effect sizes, standardised residuals, and confidence intervals, where possible.
We examined responses across key demographic groups like gender and race/ethnicity to assess systemic differences in experiences. Across our primary measures, we did not observe consistent or statistically meaningful differences. This should not be taken as evidence that inequity is not a concern. Evidence from prior technological and organisational shifts suggests disparities often emerge over time. These findings reflect a point-in-time view of an evolving transformation. As AI adoption accelerates, leadership decisions will be critical in shaping equitable outcomes. Organisations should proactively centre equity in AI transformation efforts as implementation matures.
Interviews were analysed using thematic analysis. We used an AI tool to analyse anonymous source materials and support writing. Anonymised interview transcripts were reviewed manually and with the use of AI tools to identify themes and categorise insights. Each theme was later compared to the quantitative findings before arriving at our conclusions. All content was authored by the research team.
Credits
CEO Team
Research Leads
Research Fellows
Research Team
Project Team
Sponsor Relations
Marketing and Communications
External team
© 2026 Coqual. All rights reserved. Unauthorized reproduction or transmission of any part of this publication in any form or by any means, mechanical or electronic, is prohibited. The findings, views, and recommendations expressed in Coqual reports are not prepared by, are not the responsibility of, and do not necessarily reflect the views of the sponsoring companies or other companies in the Coqual Task Force
Endnotes
- Survey respondents were asked their agreement related to: ‘My organisation helps me build AI skills that are relevant to my current role’. They were asked to respond on a 5-point Likert scale from ‘strongly disagree’ to ‘strongly agree’. A chi-square test of independence explored whether this differed based on their country of work. The data showed a significant relationship, (χ² (8) = 88.50, p <.001). Upon exploring the standardised residuals, employees in Germany responded ‘agree’ (24%, standardised residual = -2.3) and ‘strongly agree’ (4%, standardised residual = -2.0) more than was expected, as well as UK employees responded ‘agree’ (37%, standardised residual= 3.5) and ‘strongly agree’ (9%, standardised residual = 2.9) more than was expected. French employees did not differ significantly from what was expected (standardised residual < 2.0) but 27% responded ‘agree’ and 5% ‘strongly agree’. For reporting, the data were dichotomised into ‘strongly disagree, disagree, neutral’ and ‘agree, strongly agree’.
- Survey respondents were asked to state their agreement with the following statement: ‘Does your organisation have a responsible AI policy?’. Responses were provided via checkboxes, where agreement with the statement meant checking the box, while disagreement was indicated by leaving the box unchecked. 61% of respondents checked the box, thus agreeing with the statement.
- Survey respondents were asked to respond to a series of statements on whether their organisations tracked any AI-related outcomes. Responses were provided via checkboxes, where agreement with the statement meant checking the boxes, while disagreement was indicated by leaving the boxes unchecked. 95% of leaders indicated that their organisations do not track anything.
- Patrick E. Hopkins, ‘Coming soon: a lost generation of employee talent?’, Fortune, 27 January 2026, https://fortune.com/2026/01/27/lost-generation-of-employeetalent-ai-gen-z-hiring-nightmare/.
- Survey respondents were asked ‘Which response best captures your own attitude towards AI in your organisation?’, with response options being: ‘I’m an enthusiastic adopter’, ‘I’m not convinced of its value’, ‘I’m concerned AI may replace me’, and ‘Other’. 35% of employees responded that they were enthusiastic adopters.
- Survey respondents were asked to indicate if they were concerned about being replaced by AI or automation. Responses were provided via checkboxes, where agreement with the statement meant checking the box, while disagreement was indicated by leaving the box unchecked. A chi-square test of independence explored whether this fear differed based on their country of work. The data showed a mild but significant relationship (χ² (2) = 6.12, p = .05). Upon exploring the standardised residuals, no country differed significantly from what was expected (zs < 2.0), but 37% of French employees agreed they were concerned with being replaced by AI or automation (z = 1.1), along with 30% of German employees (z = -1.6), and 35% of UK employees (z = 0.4).
- Survey respondents were asked ‘To what extent do you feel your organisation effectively communicates the impact of AI adoption on employees across roles, levels, and functions?’. Responses were on a 5-point Likert scale from ‘not at all’ to ‘to a very large extent’. To reflect the belief that their organisation effectively communicates the impact of AI adoption on employees, data were aggregated across the ‘significantly’ and ‘to a very large extent’ categories. We found that 14% responded ‘not at all’, 16% responded ‘slightly’, 37% ‘moderately, 25% ‘significantly’, and 8% responded ‘to a very large extent’
- Survey respondents were asked to indicate if ‘Leaders in my organisation remain confident and supportive when navigating disruption related to AI adoption’. Responses were provided via checkboxes, where agreement with the statement meant checking the box, while disagreement was indicated by leaving the box unchecked. Overall, 16% of employees agreed with the statement, while 84% did not agree. A chi-square test of independence explored whether this differed based on their country of work. The data showed a significant relationship (χ² (2) = 22.60, p < .001). The standardised residuals indicate that results from Germany did not significantly differ from what was expected: 14% of employees in Germany agreed (z = -1.1) and 86% disagreed (z = 0.5). In the UK, employees agreed (22%, z = 3.5) more than was expected, while 78% disagreed (z = -1.5). Finally, French employees agreed (12%, z = -2.3) less than was expected and 88% disagreed (z = -1.0).
- Survey respondents were asked their agreement on the following statement: ‘To what extent do you feel leadership acts with integrity during times of business disruption?’. Responses were on a 5-point Likert scale from ‘not at all’ to ‘to a very large extent’. 9% responded ‘not at all’, 15% ‘slightly’, 43% ‘moderately’, 27% agreed ‘significantly’ with the statement and only 6% agreed ‘to a very large extent’. A chi-square test of independence explored whether responses to this statement differed based on respondents’ country of work. The data showed a significant relationship, (χ² (8) = 44.25, p < .001). In Germany, the standardised residuals indicate that 11% answered ‘slightly’ (z = -2.7), which differed significantly from what was expected. The rest of the results from Germany did not significantly differ from what was expected: 10% responded ‘not at all’ (z = 1.1), 46% ‘moderately’ (z = 1.0), 27% responded ‘significantly’ (z = 0.4) and only 6% responded ‘to a very large extent’ (standardised residual = -0.5). In the UK, 32% of employees answered ‘significantly’ (z = 2.4) more than was expected, and 8% also responded ‘to a very large extent’ (z = 2.1) more than was expected. 6% responded ‘not at all’ (z = -2.3), less than was expected, while other responses did not differ significantly from what was expected: 16% answered ‘slightly’ (z = 0.2), and 39% ‘moderately’ (z = -1.7). French employees answered ‘significantly’ (22%, z =-2.5) less than was expected, while 5% answered ‘to a very large extent’ (z = -1.4). 10% responded ‘not at all’ (z = 1.2), 19% ‘slightly’ (z = 2.3; more than was expected), and 45% ‘moderately’ (z= 0.6). For reporting purposes, the data were dichotomised into ‘not at all, slightly’ and ‘significantly, to a very large extent’.
- Survey respondents were asked to indicate their level of agreement with the following statement: ‘I am optimistic that integrating AI in my everyday work will make me more productive’. Responses were made on a 5-point Likert scale from ‘strongly disagree’ to ‘strongly agree’; however, this outcome variable was later dichtomised, grouping ‘agree’ and ‘strongly agree’ with each other and ‘strongly disagree’, ‘disagree’, and ‘neutral’ together. 47% of respondents selected ‘strongly disagree’, ‘disagree’, or ‘neutral’, whilst 53% selected ‘agree’ or ‘strongly agree’.
- Survey respondents were asked the following: ‘Do you feel safe having your data in AI systems?’. Response options were ‘yes’, ‘no’, or ‘unsure’. 37% of employees selected ‘no’, indicating they did not feel safe having their data in AI systems. A chi-square test of independence explored whether this sentiment differed based on their country of work. The data showed a significant relationship (χ² (4) = 41.52, p < .001). The standardised residuals show that results from Germany did not significantly differ fromwhat was expected: 39% of employees (z = -1.4) agreed, while 40% disagreed (z = 1.3). In the UK, employees agreed (51%, z = 3.1) more than was expected, and 27% disagreed (z = -4.1) less than was expected. Finally, French employees agreed (39%, z = -1.6) and 43% disagreed (z = 2.6) more than was expected.
- Leaders’ commitment to inclusion was explored across a few different questions. For example, survey respondents were asked to indicate their agreement with the following: ‘Leaders are adopting AI solutions that minimise the negative impact on employees’. Responses were provided via checkboxes, where agreement with the statement meant checking the box, while disagreement meant leaving the box unchecked. Overall, 79% of employees disagree that leaders in their organisation adopt AI solutions that minimise negative impacts on employees. A chi-square test of independence explored whether this sentiment differed based on their country of work. The data showed a significant relationship (χ² (8) = 24.09, p < .001). Employees in Germany agreed (16%, z = -2.6) less than was expected, while 84% disagreed (z = 1.7). In the UK, employees agreed (28%, z = 3.4) more than was expected, and 72% disagreed (z = -1.8). Results from France did not significantly differ from what was expected: 20% of French employees agreed (z = -0.7) and 80% disagreed (z = 0.4). Survey respondents were also asked their agreement with the following: ‘Leaders are taking measures to mitigate the disproportionate impact of AI on vulnerable segments of the workforce’. Responses were provided via checkboxes, where agreement with the statement meant checking the box, while disagreement meant leaving the box unchecked. 88% disagreed that leadership were taking measures to mitigate the impact of AI in this way. A chi-square test of independence explored whether this sentiment differed based on their country of work. The data showed a significant relationship (χ² (2) = 9.22, p = .01). The standardised residuals show that results from Germany did not significantly differ from what was expected: 11% of German employeesagreed (z = -0.6) and 89% disagreed (z = 0.2). In the UK, employees agreed (15%, z = 2.3) more than was expected, while 85% disagreed (z = -0.8). Like Germany, results from France did not significantly differ from what was expected: 10% of French employees agreed (z = -1.6) and 90% disagreed (z = 0.6). Finally, survey respondents were asked their level of agreement with the following: ‘My organisation is taking steps to ensure that AI does not amplify workforce inequities’. Responses were on a 5-point Likert scale from ‘strongly disagree’ to ‘strongly agree’. For reporting purposes, these were dichotomised into ‘strongly disagree, disagree, neutral’ and ‘agree, strongly agree’. 63% disagreed that their organisation was taking steps to ensure AI wouldn’t amplify inequities. A chi-square test of independence explored whether this sentiment differed based on their country of work. The data showed a significant relationship (χ² (8) = 59.65, p < .001). Upon exploring the standardised residuals, employees in Germany agreed (25%, z = -2.4) less than was expected, while 6% strongly agreed (standardised residual = -0.7). In theUK, employees responded ‘agree’ (38%, z = 3.5) more than was expected, and 8% responded ‘strongly agree’ (standardised residual = 1.2). French employees did not differ significantly from what was expected (zs < 2.0) but 28% agreed with the statement and 6% strongly agreed.
- Survey respondents were asked if ‘Leaders in my organisation have made efforts to create a more inclusive workplace culture in the past 18 months’. Responses were provided via checkboxes, where agreement with the statement meant checking the box, while disagreement meant leaving the box unchecked. Overall, 78% of employees did not agree with the statement.
- Survey respondents were asked their level of agreement with the following: ‘Our leadership is putting plans into place to reskill and upskill our people to be successful moving forward’. Responses were on a 5-point Likert scale from ‘strongly disagree’ to ‘strongly agree’; for reporting purposes, these were dichotomised into ‘strongly disagree, disagree, neutral’ and ‘agree, strongly agree’. 68% of leaders agreed or strongly agreed that they are putting effective plans into place to reskill/upskill employees. However, in contrast, employees were asked the extent to which they felt their organisation makes AI training/resources available to all employees, regardless of background or role. They were asked to respond on a 5-point Likert scale from ‘not at all’ to ‘to a very large extent’ and responses were dichotomised into ‘not at all, slightly, moderately’ and ‘significantly, to a very large extent’. Only 34% of employees agreed ‘significantly, to a very large extent’ that their organisation makes AI training/resources available to all.
- Susan Gonzales, ‘AI literacy and the new Digital Divide – A Global Call for Action’, UNESCO, 6 August 2024 (last update 23 September 2025), https://www.unesco.org/ethics-ai/en/articles/ai-literacy-and-new-digital-divide-global-call-action.
- Survey respondents were asked the extent to which they feel their organisation includes them in decisions around how AI is implemented in their team or role. Responses were on a 5-point Likert scale from ‘not at all’ to ‘to a very large extent’, and responses were dichotomised into ‘not at all, slightly, moderately’ and ‘significantly, to a very large extent’. Only 28% of employees agreed ‘significantly, to a very large extent’ that their organisation included them in AI-related decision making.
- Survey respondents were asked the extent to which they feel their organisation encourages them to provide feedback on how AI is being implemented in their team or role. Responses were on a 5-point Likert scale from ‘not at all’ to ‘to a very large extent’, and responses were dichotomised into ‘not at all, slightly, moderately’ and ‘significantly, to a very large extent’. Only 30% of employees agreed ‘significantly, to a very large extent’ that their organisation seeks their input on how AI is being implemented in their team or role.
- Ashleigh Popera, ‘When Automation Backfires: How Rushed AI Implementation Can Hurt Employee Engagement’, Enterprise Insights (Society for Human Resource Management (SHRM)), 14 November 2024, https://www.shrm.org/enterprise-solutions/insights/when-automation-backfires--how-rushed-ai-implementation-can-hurt0; Arvato Connect, ‘Turning Attrition to Retention’, 18 June 2025, https:// www.arvatoconnect.co.uk/wp-content/uploads/2025/06/ArvatoConnect_-Impactof-AI-on-agents.pdf; Asana Work Innovation Lab, ‘State of AI at Work’, Asana, 2025, https://assets.asana.biz/m/10543e5e3bcb38f5/original/2025-Global-State-of-AI-at-Work.pdf; PwC, ‘Rewiring the future of work’, PwC Global Workforce Hopes and Fears Survey 2025, 12 November 2025, https://www.pwc.com/gx/en/issues/workforce/hopes-and-fears.html.
- The Convergent Leader (n = 372, 37% of total leaders surveyed) group reflects a senior cohort where 40% (n = 148) are in second-level management roles, 48% (n = 180) are senior level managers, and 12% (n = 44) are CEOs. Gender is evenly distributed, with 48% (n = 179) women and 52% (n = 193) men. Two-thirds of this group identify as white (68%), while 32% identify with race or ethnicities other than white, including 19% Black, 4% MENA, 4.5% prefer not to say, 2% Eastern European, 2% Asian, and less than 1% indicating they are Latinx or multiracial. Educational attainment is high: 82% hold a university degree or above. This includes 4% with an associate’s degree, 28.5% with a bachelor’s degree, and 49.5% with an advanced degree. Additionally, 96.5% report not having a disability, 95% do not identify as neurodivergent, and 95% identify as heterosexual. Geographically, the majority are based in the United Kingdom (55%, n = 206), with 25% (n = 91) based in Germany and 20% (n = 75) in France.
- Kathy Robotham, PhD, and Tara Van Bommel, PhD, ‘Developing Cognitive Flexibility,’ Adapt or Fail: How Managers Can Enable Everyone to Thrive at Work, Catalyst, 6 August 2025, https://www.catalyst.org/insights/2022/managers-adapt-future-of-work-report.
- A one-way ANOVA was conducted to investigate the relationship between leadership clusters and whether leaders feel confident in their ability to keep up with AI developments and understand their implications for their business. The data indicated a significant effect (F(2, 991) = 254.05, p < .001), where Tukey post-hoc comparisons confirmed that Convergent Leaders scored higher than the other leadership clusters (ps < .001).
- A one-way ANOVA was conducted to investigate the relationship between leadership clusters and whether leaders feel comfortable navigating and supporting their team through unfamiliar situations. The data indicated a significant effect (F(2, 991) = 153.40, p < .001), where Tukey post-hoc comparisons confirmed that Convergent Leaders scored higher than the other leadership clusters (ps < .001).
- A series of chi-square tests of independence highlighted how Convergent Leaders reported thinking the following skills were extremely important for their future career success significantly more than mid-tier and lower-tier leaders: AI and technology literacy (54%), cybersecurity and privacy awareness (54%), creativity and imagination (53%), analytical thinking (51%), managing complexity (51%), digital ethics and responsible use (50%), building productive teams (48%), openness and flexibility (46%), self-leadership (46%), curiosity and learning (44%), leading across differences (44%), data fluency (43%), inspiring purpose (43%), and storytelling and communication (39%). All relationships were significant at the p < .001 level and standardised residuals were all ≥7.6. Crucially, when these skills were entered into a Principal Components Analysis, they all loaded onto a single factor, suggesting that Convergent Leaders did not discriminate between technical and non-technical skills in their pursuit of future skills.
- A one-way ANOVA was conducted to investigate the relationship between leadership clusters and whether leaders prioritise human skills as much as technical skills across hiring, promotions and performance reviews. The data indicated a significant effect for hiring (F (2, 991) = 237.01, p < .001), promotions (F (2,991) = 247.04, p < .001), and performance reviews (F (2,991) = 246.32, p < .001), where Tukey post-hoc comparisons confirmed that high potential leaders scored higher than the other leadership clusters (p < .001).
- Thirty-three variables including questions related to the importance of future skills, upskilling and development opportunities, inclusive leadership behaviours, and AIrelated skills were entered into a Principal Components Analysis. The analysis revealed four different factors, which explained 61% of the variance: 1) inclusive leadership behaviours, 2) skills development, 3) prioritising human skills in organisational processes, and 4) the perception of future skills. These four factors were entered into a K-means cluster analysis to explore patterns of leadership. The solution revealed three clusters: a convergent leadership group (n = 372, 37%), a mid-tier leadership group (n = 440, 44%), and a lower-tier leadership group (n =182, 18%). The convergent leadership group was then taken forward to explore their skillset further.
p < .001), increased revenue or profit margin (χ² (2) = 47.26, p < .001), increased customer loyalty or satisfaction (χ² (2) = 71.55, p < .001), enhanced operational efficiencies and reduce costs (χ² (2) = 32.03, p < .001), reduced employee turnover or increased retention (χ² (2) = 7.66, p = .02), and the launch of new innovative products or services (χ² (2) = 43.30, p < .001). Survey respondents were also asked their level of agreement with the following statement: ‘In the last 18 months, my team’s productivity has increased’. Responses were on a 5-point Likert scale from ‘strongly disagree’ to ‘strongly agree’. Responses were dichotomised into ‘strongly disagree, disagree, neither agree nor disagree’, and ‘agree, strongly agree’. A chi-square test of independence explored whether Convergent Leaders outperformed non-Convergent Leaders on this outcome. The data indicated a significant effect, χ² (8) = 358.78, p < .001. - A chi-square test of independence explored whether empowered and unsupported employees reported different engagement levels. The data showed a significant relationship (χ² (4) = 118.05, p < .001). Empowered employees agreed (46%, z = 2.0) or strongly agreed (28%, z = 3.5) that they were engaged at work, and standardised residuals indicate that this level of agreement was more than was expected. Unsupported employees, on the other hand, agreed (37%, z = -2.3) or strongly agreed (16%, z = -4.1) that they were engaged at work, and standardised residuals suggest that this level of agreement was less than was expected.
- A chi-square test of independence explored whether empowered and unsupported employees reported different attitudes towards AI. The data showed a significant relationship (χ² (3) = 172.62, p < .001). More empowered employees reported being enthusiastic AI adopters compared to unsupported employees (47% versus 18%). Upon exploring the standardised residuals, empowered employees indicated they were an ‘enthusiastic AI adopter’ (z = 6.8) more often than was expected, while unsupported employees responded they were an ‘enthusiastic AI adopter’ less often than was expected (z = -8.0).
- Eighteen variables including questions related to the organisational approach to AI adoption, inclusive leadership behaviours, and whether leadership are able to navigate this change successfully were entered into a Principal Components Analysis. The analysis revealed two different factors, which explained 60% of the variance: 1) organisational support, and 2) leadership support. These two factors were entered into a K-means cluster analysis to explore patterns of employees. The solution revealed two clusters: an empowered employee group (n = 1,096, 58%), and an unsupported employee group (n = 801, 42%).