A new path to inclusion: Closing the credibility gap in Canada

14 min read
| Published onExecutive summary
This report examines the current state of inclusion efforts in organizations in Canada and explores their impact on employees’ experiences. Based on a survey of over 1,600 Canadian employees and leaders,1 we find that many organizations are facing a credibility gap. Even when organizations remain largely committed to diversity, equity, and inclusion (DEI), the signals they send matter. When employees perceive mixed messages about the organization's commitment — whether through rebranding, reduced emphasis of inclusion efforts, or other subtle shifts — they are more likely to experience burnout, distrust their organization, and consider leaving. In short, the credibility gap comes with measurable costs.
But these negative outcomes are not inevitable. Organizations and HR leaders who maintain visible inclusion efforts and communicate transparently foster a workforce that is more trusting, less burned out, more engaged, and more likely to stay — demonstrating that credibility is not just a cultural asset, but a business one.
How to cite: Agnihotri, N. & Shaffer, E. (2026). A new path to inclusion: Closing the credibility gap in Canada. Catalyst.
Catalyst and the Meltzer Center’s report, A new path to inclusion: How to overcome legal and cultural constraints on building fair workplaces, found that the majority of organizations in the United States are adjusting their approach to inclusion. These shifts are not happening in isolation. Because many organizations operate across borders, changes to the inclusion efforts in one context can shape strategies, expectations, and outcomes elsewhere.
This raises important questions about how inclusion work is evolving beyond the United States. In Canada, organizations are navigating pressures similar to those in the United States while also responding to their own workforce and business realities. Understanding these dynamics is critical for leaders who are trying to maintain credibility and trust while adapting their approach.
The credibility gap is costly for organizations
With all the discussion around diversity, equity, and inclusion efforts globally and in Canada, employees are paying close attention to their organizations’ actions. Pulling back on inclusion, even subtly, can signal to employees that the work is no longer valued. Our research finds that when the message from the organization stops matching day-to-day reality, employees respond with lower trust, rising exhaustion, and serious reconsideration of their future with the company.
We call it the credibility gap: the widening disconnect between what organizations say about inclusion and what employees actually experience at work.
How does the credibility gap show up?
To understand how this credibility gap emerges, it is crucial to observe the changes organizations are making and signals employees may be receiving from their organizations. Almost half of Canadian organizations (45%) have increased their inclusion efforts, while 27% have decreased, and 28% have made no changes.2 Yet employees may be seeing signs of retreat that extend beyond formal organizational decisions. Although only a quarter of employees report that their organization has decreased inclusion efforts, 43% say their organization has publicly signaled a move away from DEI.3 This suggests that employees may be picking up on cues that inclusion is becoming less of a priority, even when organizations are not formally scaling back their efforts. These signals appear in several ways:
- About 40% of Canadian organizations4 have rebranded their inclusion efforts, swapping specific language for more generic terms like "employee engagement," "wellbeing," or "workplace culture."
- Roughly half of organizations5 have removed inclusion-related content from at least one major communication channel, such as learning materials or courses, employee resource group content/events, and annual reports.
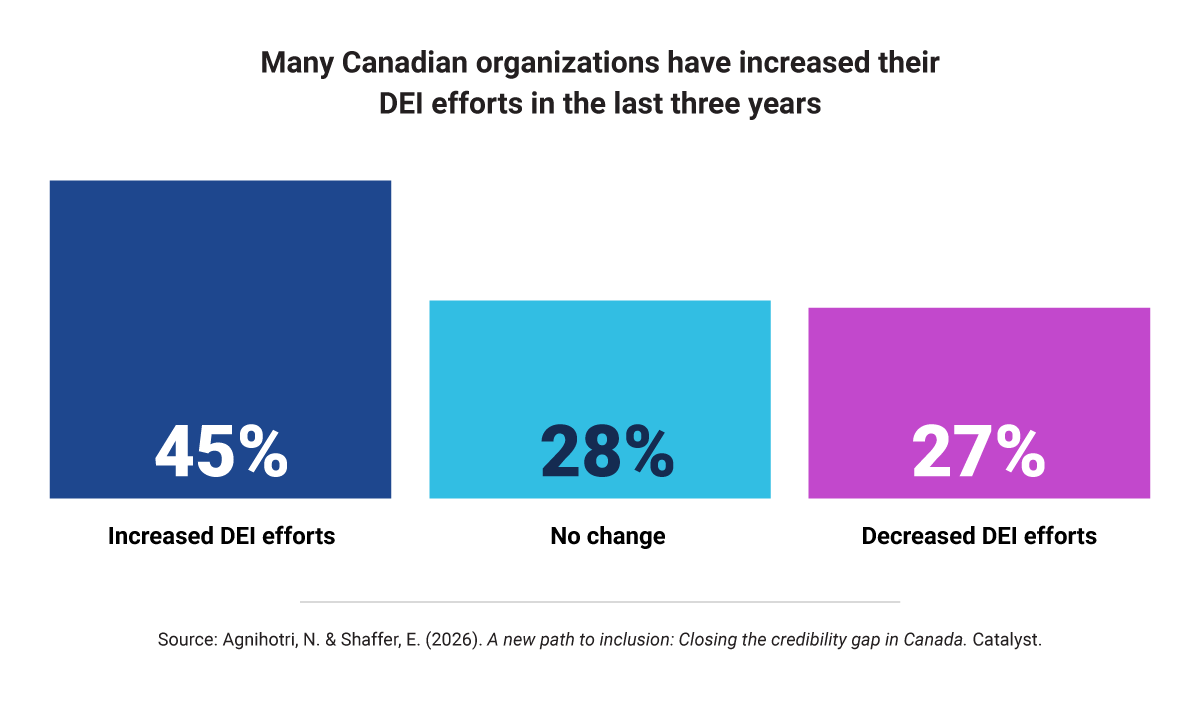
While organizations may choose to adapt their strategy to mitigate risk, it’s important that they understand the consequences so they can address them proactively. For example, when organizational DEI efforts decreased, employee burnout was higher (56%) than it was in organizations with no change in DEI approach (35%).6
In addition, a greater percentage of employees who said inclusion content was removed from a communication channel reported experiencing burnout compared to those who did not.7 This pattern also holds in organizations that rebranded their DEI approach: burnout is more frequent in these organizations than in those that did not rebrand.8
However, rebranding and removal don’t necessarily happen in isolation. Many organizations are engaging in both of these practices.
- 68% of employees in organizations that rebranded their programs also observed at least one instance of removing DEI references from a communication channel.9
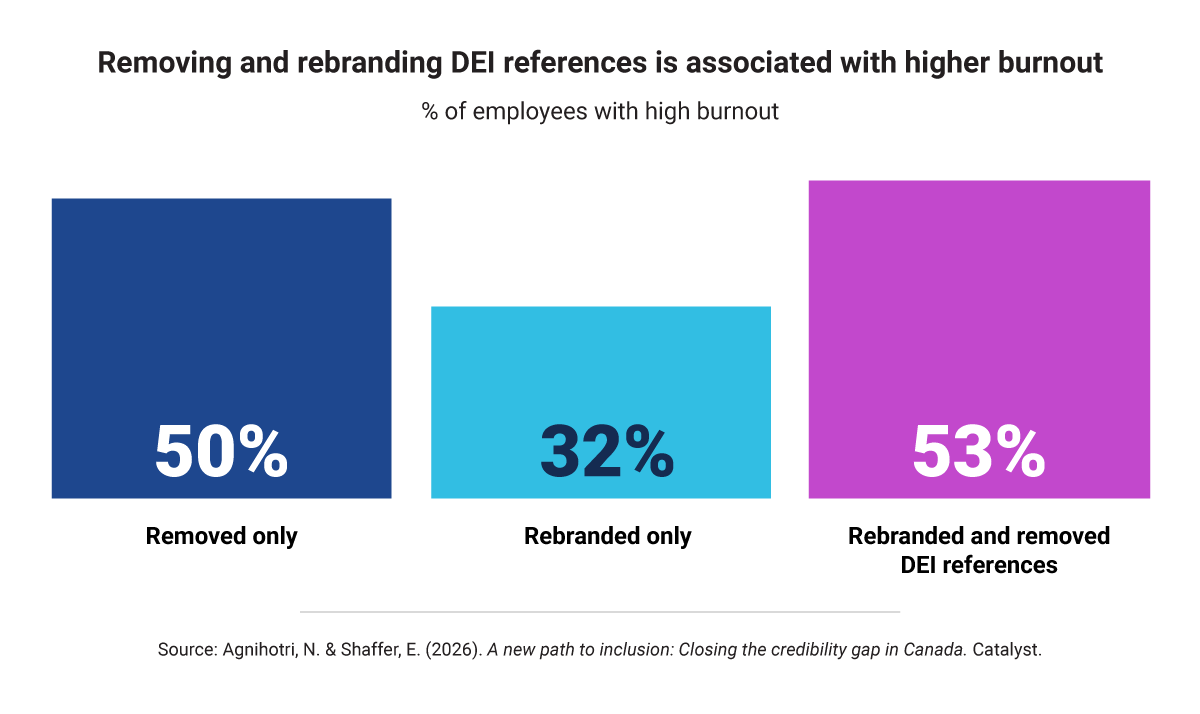
This pattern suggests that rebranding is often accompanied by real cuts in visibility, not just a change in terminology. Because of this, we examined the impact of these shifts to determine how employees at organizations that only rebranded, only removed references, or engaged in both of these changes experienced burnout.
Interestingly, we found that signaling a rebrand alone does not appear to have a strong negative impact on burnout. Only 32% of employees reported frequent burnout when organizations rebrand without removing references to inclusion. In organizations that only removed references to inclusion and did not rebrand, half of employees (50%) reported high burnout. Additionally, in organizations that rebrand and remove references, rates of high burnout are only 3 percentage points higher than removal alone,10 indicating that while there is a slight additive impact of engaging in both practices, removing references to inclusion is what may be driving the association with employee burnout.
Take action: Two levers that close the credibility gap
The credibility gap is real, but it is not inevitable. Our data show that organizations that maintain visible inclusion efforts and communicate changes transparently see improved outcomes: lower burnout, greater trust, and a workforce that genuinely values the organization's approach to inclusion.
Visibility
Keep inclusion visible by maintaining clear and consistent signals about inclusion efforts — even as approaches evolve — so they remain recognizable to employees.
While visibility may seem risky at times, it can also be protective. Emphasizing inclusion-related content, increasing visibility of employee resource groups (ERGs), and spotlighting inclusion in communications are consistently associated with lower burnout. For instance, ERGs are a powerful lever. Employees who see active ERGs in their workplace are approximately 20% less likely to report frequent burnout.13 This is tangible evidence that sustaining visible support for diverse groups is associated with greater wellbeing.
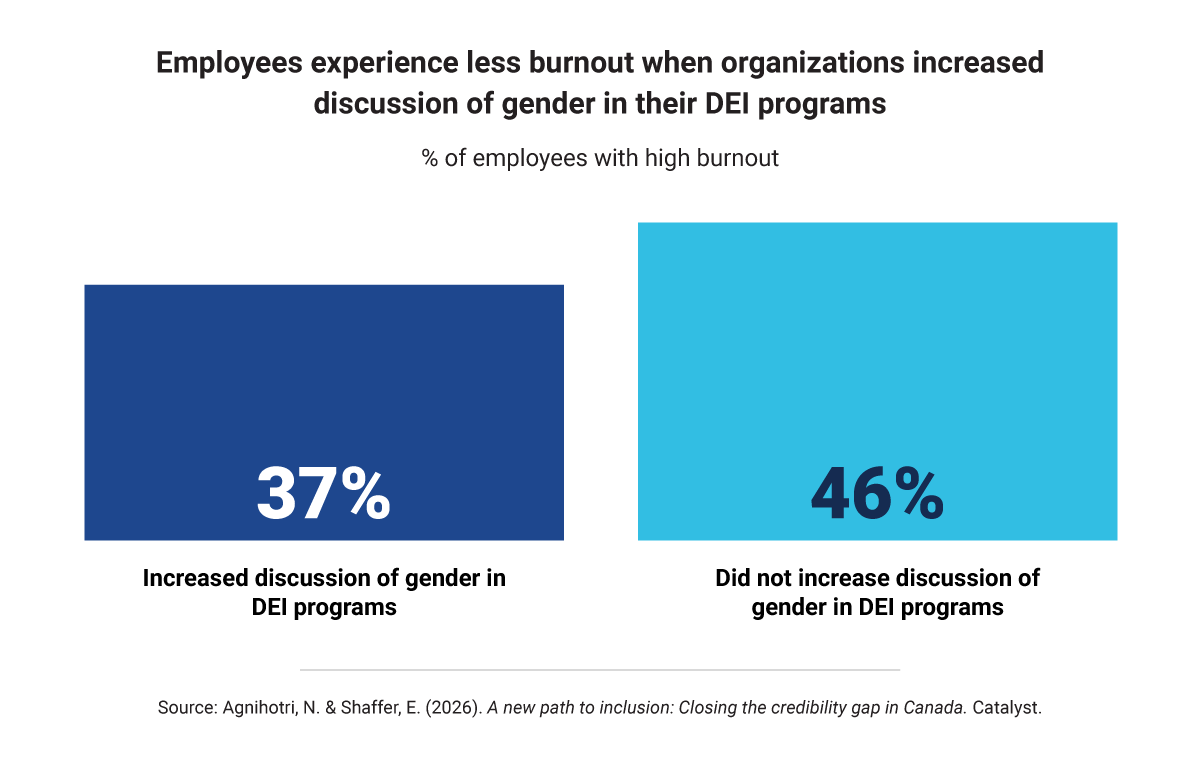
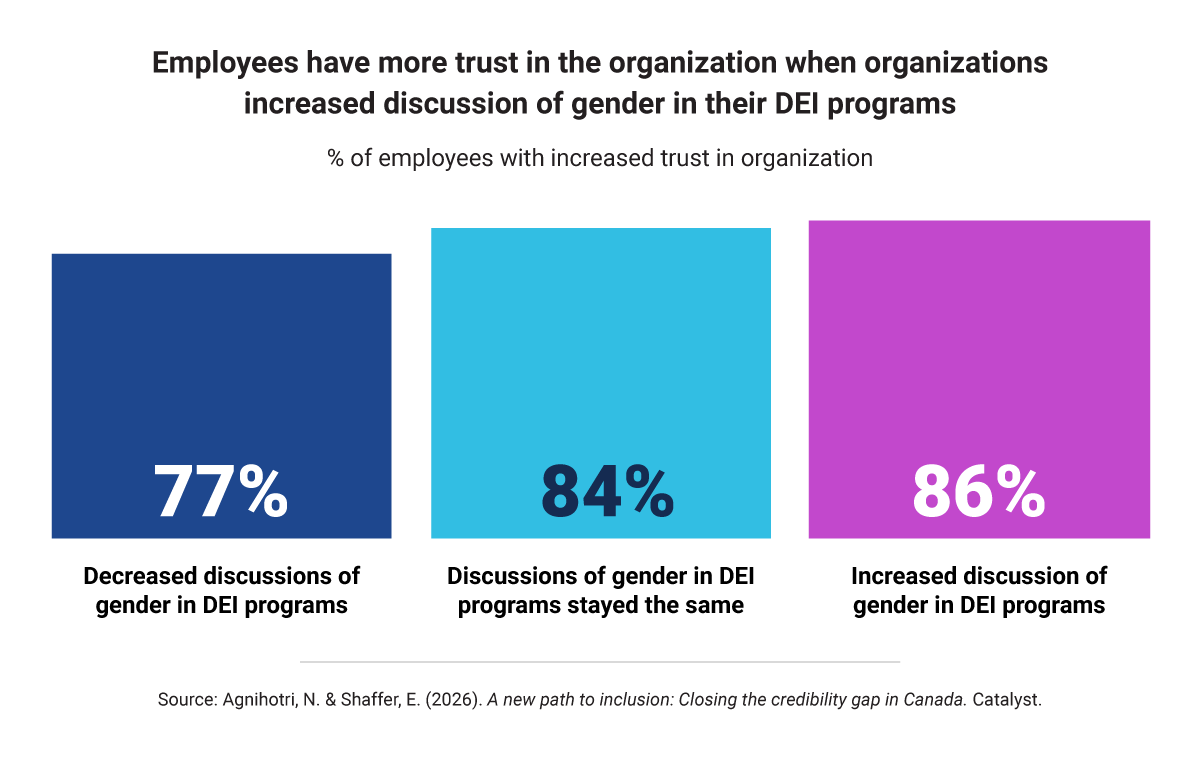
Furthermore, employees who see inclusion-related content being emphasized report less burnout than employees that do not see this emphasis.14 Finally, employees have more trust in their employer when they say it has talked more about inclusion-related topics such as gender in the last three years.15
Communication
Communicate clearly by explaining changes and helping employees understand why they’re being made.
Silence is the most damaging strategy of all. When shifts in inclusion strategy are explained clearly, 84% of employees say their organization’s approach to inclusion is valuable, versus just 57% when changes go unexplained.16
Clear communication also shapes employees’ day-to-day experience of inclusion: 92% of employees report positive experiences of inclusion when changes are communicated transparently, compared to 68% when they are not.17
The leadership imperative
The evidence points to one clear conclusion: the real risk to engagement and retention is not change itself, but rather the credibility gap that opens when the organization’s words and actions diverge. Quietly scaling back or renaming inclusion initiatives can have profound, measurable consequences for engagement, wellbeing, and trust.
Organizations and leaders that keep their commitment to inclusion visible and communicate transparently can sustain trust and energy even through significant strategic shifts.
Closing the credibility gap is not just the right thing to do for employees. It is a direct investment in performance, retention, and long-term organizational success.
Transparency is no longer optional — it directly shapes how employees experience and respond to their organization’s inclusion efforts.
Thank you to the Meltzer Center for Diversity, Inclusion, and Belonging for their contribution to and collaboration on this research.
Endnotes
- We surveyed 1,609 employees and leaders based in Canada in a range of industries including education (n = 158, 10%), healthcare and medical (n = 157, 10%), retail (n = 127, 8%), government and military (n = 122, 8%), finance, banking, and insurance (n = 121, 8%), accounting (n = 112, 7%), and business and professional services (n = 82, 5%). Our sample was slightly more women (55%, n = 878) than men (44%, n = 710), with a small proportion identifying as another gender (1%, n = 19). Most respondents identified as heterosexual (85%, n = 1,374), while 12% (n = 199) identified as LGBTQA. The sample was majority White (64%, n = 1,032), with representation from a range of racial and ethnic identities including Asian (14%, n = 231), Black (9%, n = 137), Latine (1%, n = 22), Indigenous (2%, n = 34), MENA (2%, n = 34), mixed race (4%, n = 63), and respondents who self-described their identity or preferred not to say (< 1%, n = 9). The average respondent’s age was 41 years old, and ages ranged from 19 to 76. More than half of respondents were Millennials (n = 853, 53%), around a quarter were Gen X (n = 374, 23%), 19% were Gen Z (n = 298), and 5% were Baby Boomers (n = 84). Finally, a majority held mid-level roles (n = 886, 55%), followed by senior-level (n = 389, 24%), entry-level (n = 301, 19%), and executive positions (n = 33, 2%). Note that participants could select multiple identity categories and could skip demographic questions; therefore, totals may not sum to 100% or the total sample size.
- An organization’s approach to DEI was gauged with the following item: “On the whole, how has your organization changed its approach to its DEI efforts in the last three years?” Response options were “Decreased DEI efforts significantly,” “Decreased DEI efforts somewhat,” “My organization has not changed its approach,” “Increased DEI efforts somewhat,” and “Increased DEI efforts significantly.” For reporting purposes, we combined the options into three categories: decreased DEI, no change to DEI, and increased DEI. We did not include those who responded with “I don’t know” in our analyses.
- Participants were asked to indicate whether their organization had taken steps to publicly move away from DEI (yes, no).
- Respondents were asked whether their organization had rebranded (i.e., renamed or described differently) its DEI office or programs in the past three years, with response options of “yes,” “no,” and “I don’t know.” For analysis, responses were recoded into a dichotomous variable, retaining only “yes” and “no” responses and excluding “I don’t know.” Forty percent reported that their organization had rebranded its DEI efforts. Among respondents who reported that their organization had rebranded its DEI office or programs, we examined the terminology used to describe these efforts. This analysis was restricted to those who indicated rebranding occurred (n = 563), and respondents could select multiple terms. Nearly half of reported rebranding included “employee engagement” (49%), followed by “wellness, wellbeing, or employee care” (46%) and “workplace culture” (45%). A smaller proportion referenced “people, humanity, or community” (40%). Percentages may sum to more than 100% due to the multiple-response nature of the question.
- Respondents were asked whether they had observed at least one instance of DEI reference removal across organizational communication channels. Almost half (51%) of the participants reported observing at least one instance of removal, while 49% reported no removal.
- Burnout was measured using an eight-item composite assessing how often respondents experienced burnout-related feelings at work. Items were measured on a 5-point scale from 1 = “Never” to 5 = “Always,” with positively worded items reverse-coded so that higher scores consistently reflected greater burnout. For analysis, items were dichotomized into low frequency (“never,” “rarely,” and “sometimes”) and high frequency (“often” and “always”). A chi-square test of independence revealed a statistically significant association between organizational approach to DEI and employee burnout, χ²(2) = 54.36, p < .001. A greater percentage of employees in organizations that decreased DEI efforts reported more burnout (56%, z = 7.4) than expected, while those in organizations with no change (35%, z = -2.9) or those in organizations that increased DEI efforts (35%, z = -3.9) reported less burnout than expected.
- Respondents were asked whether their organization had removed references to DEI-related work from any communication channels over the past three years. Response options were “Removed DEI references completely,” “Removed DEI references somewhat,” “No change in DEI references,” “Did not remove, in fact, emphasized DEI references,” and “I don’t know.” A binary variable was constructed to capture whether respondents observed at least one instance of DEI reference removal (“no,” “yes”). A chi-square test of independence revealed a statistically significant association between DEI reference removal and employee burnout, χ²(1) = 72.08, p < .001. A greater percentage of employees in organizations that removed DEI-related content reported burnout (51%, z = 8.5) more than expected, while those in organizations with no removal (30%, z = -8.5) reported burnout less than expected.
- A chi-square test of independence revealed a statistically significant association between DEI rebranding and employee burnout, χ²(1) = 10.77, p = .001. Almost half of employees in organizations that rebranded DEI efforts reported more burnout (46%, z = 3.3) than expected, while 38% of employees in organizations that did not rebrand reported less burnout than expected (z = -3.3).
- A chi-square test of independence revealed a statistically significant association between DEI rebranding and the removal of DEI-related content, χ²(1) = 85.05, p < .001. Sixty eight percent of employees in organizations that had rebranded their DEI efforts reported that DEI-related content had been removed (z = 9.2) more than expected, while 43% of those in organizations that had not rebranded (z = -9.2) reported less DEI removal than expected.
- Respondents were classified into three groups based on whether their organization reduced DEI references without rebranding, rebranded without removing DEI references, or both rebranded and removed DEI references. Removal was defined as observing at least one instance of DEI reference removal, and rebranding was measured using a dichotomous variable. Burnout was measured using a dichotomous composite indicator for infrequent (“never,” “rarely,” and “sometimes”) and frequent (“often,” “always”) burnout. A chi-square test of independence revealed a statistically significant association between DEI change patterns and employee burnout, χ²(2) = 22.56, p < .001. Employees in organizations that rebranded without removing DEI references reported burnout (32%, z = -4.7) less than expected. In contrast, employees in organizations that both rebranded and removed DEI references reported burnout (53%, z = 2.8) more than was expected. Employees in organizations that reduced DEI references without rebranding reported burnout at a rate of 50% (z = 0.9).
- Respondents were asked how likely they were to leave their job in the next year and how often they think about leaving their current job, using 5-point scales ranging from 1 = “Extremely unlikely”/ “Never” to 5 = “Extremely likely”/ “Always.” Thinking about leaving was dichotomized into infrequent (“never,” “rarely,” and “sometimes”) responses and frequent (“often,” “always”) responses. Likelihood of leaving was dichotomized to group unlikely ("extremely unlikely," "unlikely," and "neutral") and likely ("likely" and "extremely likely") responses. Burnout was measured using a dichotomous composite indicator. A chi-square test of independence revealed a statistically significant association between likelihood of leaving and employee burnout, χ²(1) = 106.48, p < .001. Employees who said they were likely to leave their job reported burnout (64%, z = 10.3) more than expected, while those who were not likely to leave (34%, z = -10.3) reported burnout less than expected. A chi-square test of independence revealed a statistically significant association between considering leaving and employee burnout, χ²(1) = 136.40, p < .001. Employees who said they often or always think about leaving their job reported burnout (69%, z = 11.7) more than expected, while those who did not think about leaving reported burnout less than expected (34%, z = -11.7).
- Freitas, M., Moreira, A., & Ramos, F. (2023). Occupational stress and turnover intentions in employees of the Portuguese Tax and Customs Authority: Mediating effect of burnout and moderating effect of motivation. Administrative Sciences, 13(12), 251; Martinez et al. (2025). The health and economic burden of employee burnout to U.S. employers. American Journal of Preventive Medicine, 68(4), 645-655.
- Respondents were asked whether they had observed changes in the activities of employee resource groups (ERGs) over the past three years, including greater visibility across the organization. Question format was a checkbox, such that checking the box meant “yes” (i.e., respondents observed this change) and leaving the box unchecked meant “no.” A chi-square test of independence revealed a statistically significant association between ERG visibility and employee burnout, χ²(1) = 4.92, p = .027. Employees who observed greater ERG visibility reported burnout (38%, z = -2.2) less than expected, while those who did not observe increased visibility reported burnout (47%, z = 2.2) more than was expected. The difference between 47% and 38% represents a relative reduction of approximately 20% in reported burnout among employees who observed greater ERG visibility.
- A binary variable was created to indicate whether respondents observed at least one instance of increased emphasis of DEI across public materials and internal communications (“no,” “yes”). A chi-square test of independence revealed a statistically significant association between observed DEI emphasis and employee burnout, χ²(1) = 11.87, p < .001. Employees who reported observing increased emphasis reported burnout (37%, z = -3.4) less than expected, while those who did not observe such emphasis reported burnout (46%, z = 3.4) more than expected. This pattern indicates that employees seeing DEI-related emphasis in communication materials reported burnout less than expected.
- Emphasis on gender was measured using an item that assessed the extent to which DEI programs discussed gender. Responses were on a 1 (“considerably less than before”) to 5 (“considerably more than before”) scale. Responses were recoded to reflect whether this topic was emphasized less, the same, or more. To measure trust, respondents indicated their level of agreement with the statement: “In the past three years, my organization’s approach to DEI has had a positive impact on my trust in the organization.” For reporting purposes, responses were dichotomized into disagreement (“strongly disagree,” “disagree,” and “slightly disagree”) and agreement (“slightly agree,” “agree,” and “strongly agree”). A chi-square test of independence revealed a statistically significant association between perceived organizational emphasis on the topic of gender and employees’ trust in their organization, χ²(2) = 13.55, p = .001. Among respondents who said their organization emphasized gender more, 86% (z = 2.3) trust their employer more than expected, while 77% of employees who said their organization emphasized gender less trusted their organization (z = -3.5) less than expected. Also, 84% of employees who said their organization emphasized gender the same trusted their organization more than expected (84%, z = 0.8), though the standardized residual was not above the threshold of 2, making this not statistically meaningful.
- Respondents were asked whether their organization had clearly communicated changes to its DEI efforts and the reasons for those changes. Responses were measured on a 1 (“strongly disagree”) to 6 (“strongly agree”) scale. For reporting purposes, responses were dichotomized into disagreement (“strongly disagree,” “disagree,” and “slightly disagree”) and agreement (“slightly agree,” “agree,” and “strongly agree”). Respondents were also asked the extent to which they perceived their organization’s DEI approach as valuable. Responses were measured on a 1 (“very valuable”) to 4 (“not at all valuable”) scale. Responses were dichotomized into valuable (“very valuable” and “somewhat valuable”) and not valuable (“a little valuable” and “not at all valuable”). A chi-square test of independence revealed a statistically significant association between clear communication of DEI changes and employees’ perceived value of their organization’s DEI approach, χ²(1) = 77.44, p < .001. Employees who reported that changes were clearly communicated viewed their organization’s DEI approach as valuable (84%, z = 8.8) more than expected, while those who reported that changes were not clearly communicated viewed their organization’s approach as valuable less than expected (57%, z = -8.8).
- Experiences of inclusion was measured using the following item: “In the past three years, my organization’s approach to DEI has had a positive impact on my experiences of inclusion.” Responses were measured on a 1 (“strongly disagree”) to 6 (“strongly agree”) scale. For reporting purposes, this variable was dichotomized into disagreement (“strongly disagree,” “disagree,” and “slightly disagree”) and agreement (“slightly agree,” “agree,” and “strongly agree”). A chi-square test of independence revealed a statistically significant association between clear communication of DEI changes and positive inclusion experiences, χ²(1) = 87.78, p < .001. Employees who reported that changes were clearly communicated reported positive inclusion experiences (92%, z = 9.4) more than expected, while those who reported that changes were not clearly communicated reported positive inclusion experiences less than expected (68%, z = -9.4).